Thermal shift assay#
Introduction#
In a Thermal Shift Assay (TSA), we use a protein-binding dye, such as SYPRO® Orange (Molecular Probes), and a real-time PCR system, such as the LightCycler® 480 Instrument II (Roche), to measure a protein melting curve (i.e. a fluorescence versus temperature plot). Basically, when the protein unfolds due to an increase in temperature, the dye binds to its exposed hydrophobic residues. This results in an increase in fluorescence. A typical result is shown below:
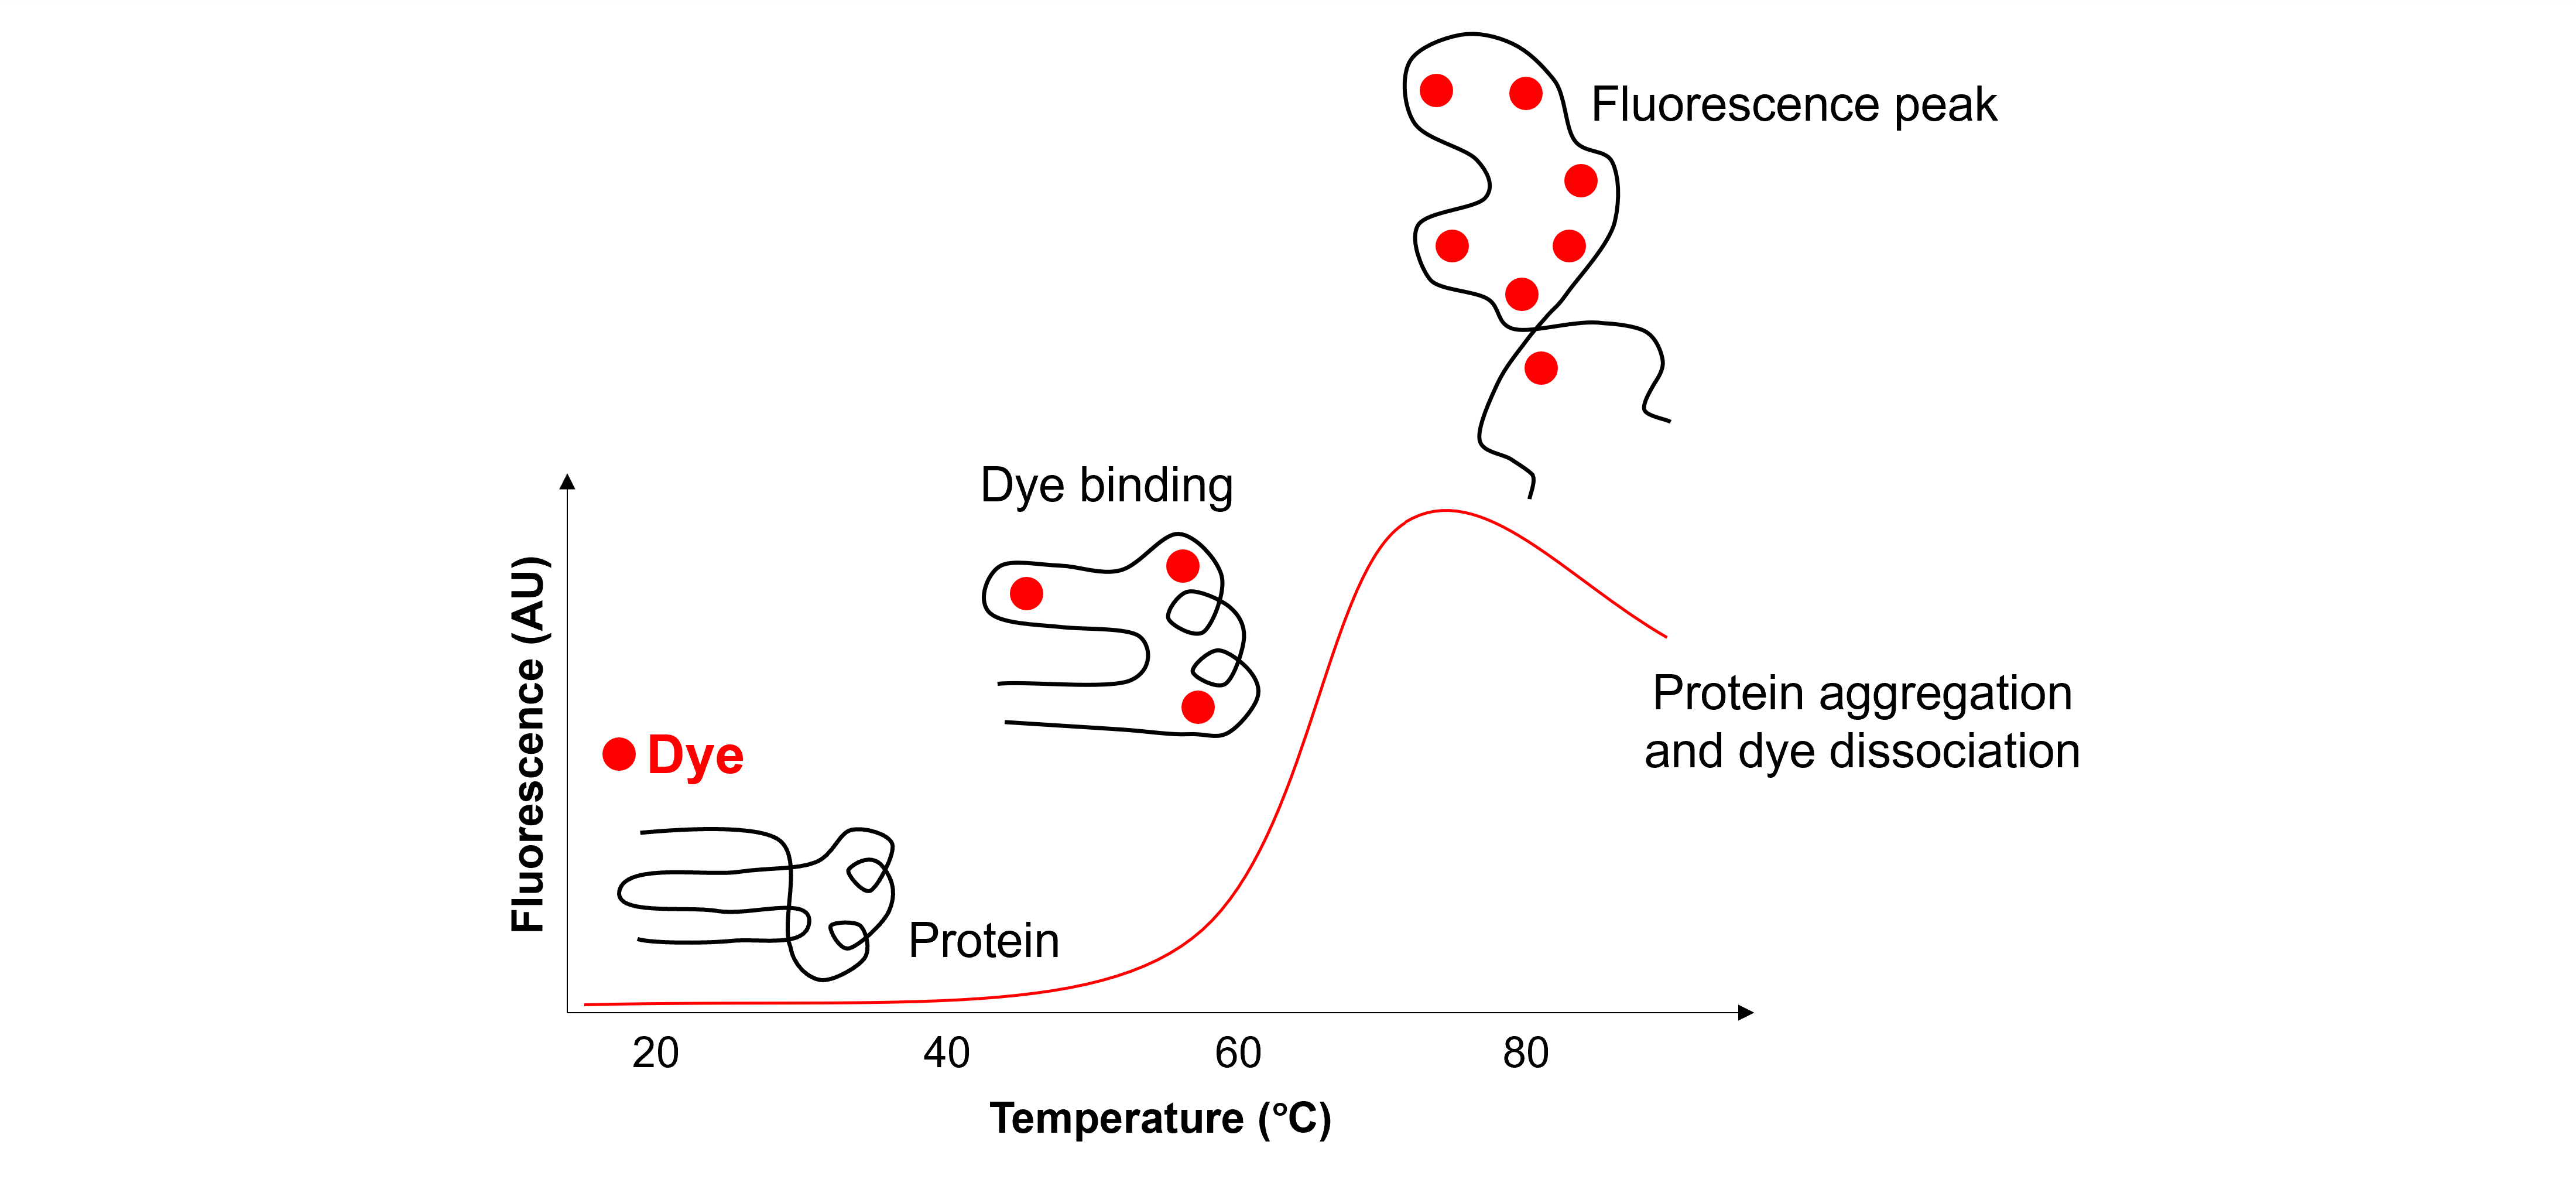
These melting curves can be used to calculate the protein’s melting temperature, i.e. \(T_m\), for each test buffer. Changes in \(T_m\) are related to changes in protein stability.
This notebook shows you how to analyze protein melting curves generated by the LightCycler® 480 Instrument II using Python.
Data#
Get the data needed for this exercise here.
The data we will analyze are from an optimization run to determine the optimal protein and dye concentrations for the TSA.
Protein: T4 Lysozyme WT* (i.e. C54T/C97A)
Protein storage buffer: 50 mM sodium phosphate, 2 mM ethylenediamine tetra-acetic acid, 350 mM NaCl, pH 6.5
Dye: SYPRO® Orange (Thermo Scientific)
Assay buffer: 1 x PBS (Lonza), pH 7.41
Sample volume: 20 µl
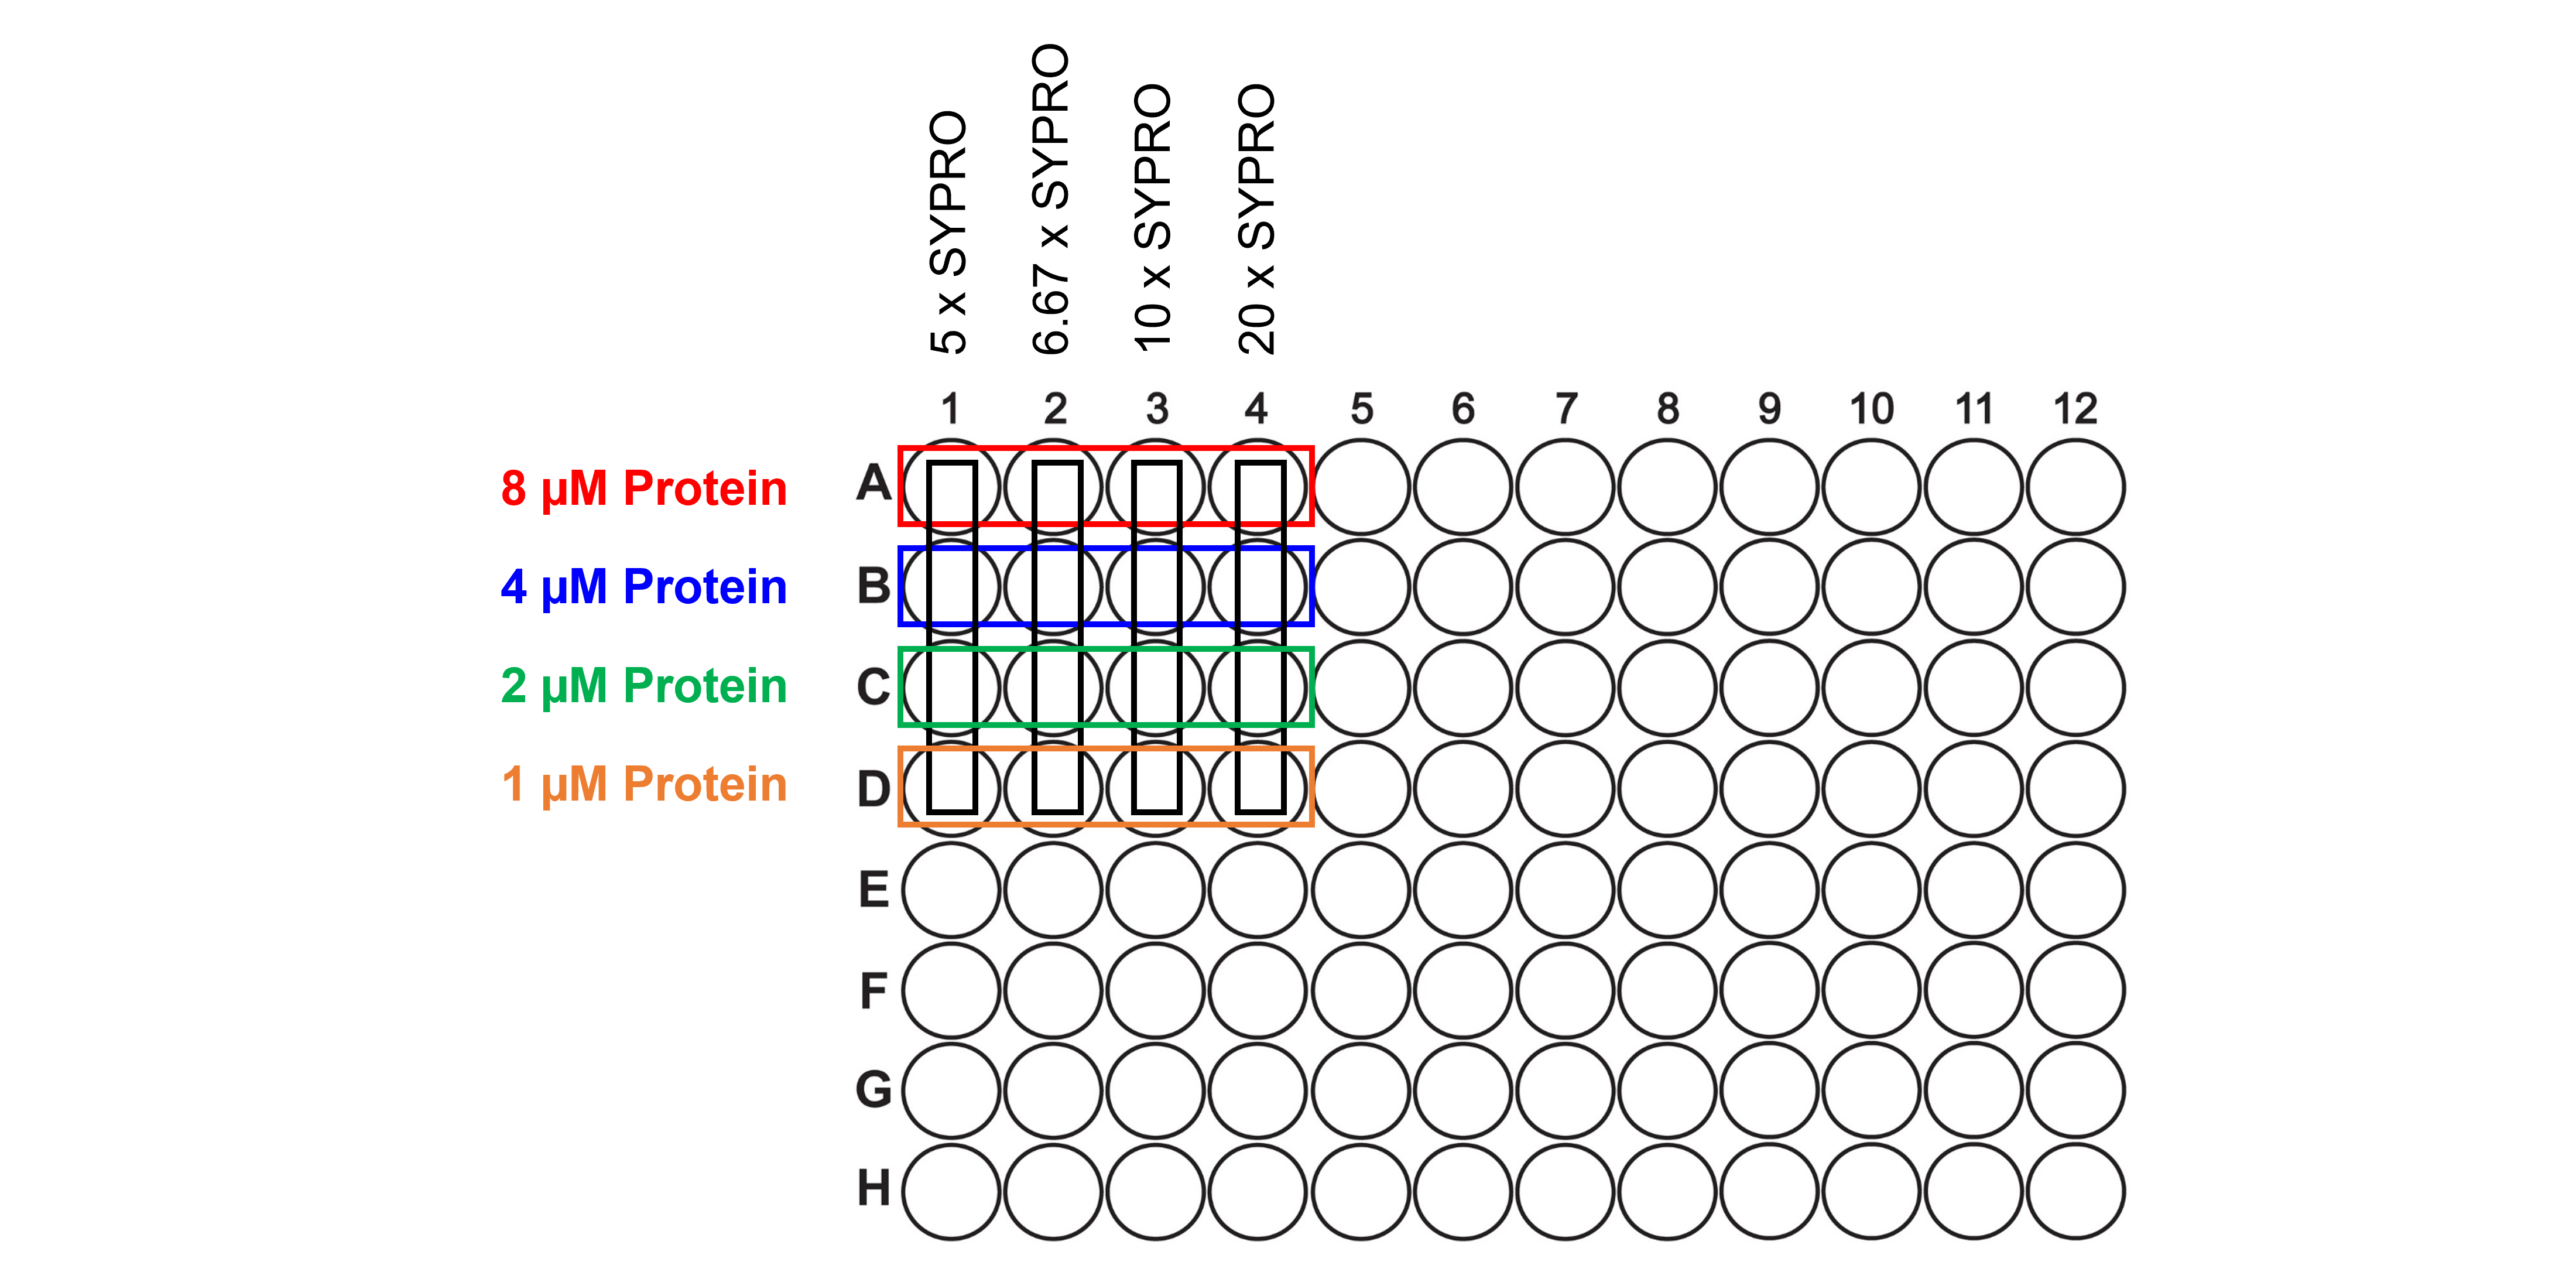
Protein concentration: 8, 4, 2, and 1 µM
Dye concentration: 5, 6.67, 10 and 20 x
Data acquisition:
Excitation: 465nm
Emission: 580nm
Temperature: 20-85°C, in smooth ramp mode, rate of 0.06°C \(s^{-1}\)
Plate: LightCycler® 480 multi-well plate 96, white (Roche) with sealing foil
The fluorescence measured at 580 nm after excitation at 465 nm as a function of temperature (from 20 to 85°C) is in A1 to D4. The figure below explains the 96-well plate lay-out:
Import the libraries needed#
import numpy as np
import matplotlib.pyplot as plt
import matplotlib.gridspec as gridspec
import pandas as pd
from scipy.optimize import curve_fit
from scipy.ndimage import uniform_filter1d # to smoothen data, see the tip below
from scipy.signal import savgol_filter # to smoothen data, see the tip below
For well A1#
Read the data from the file and select well A1#
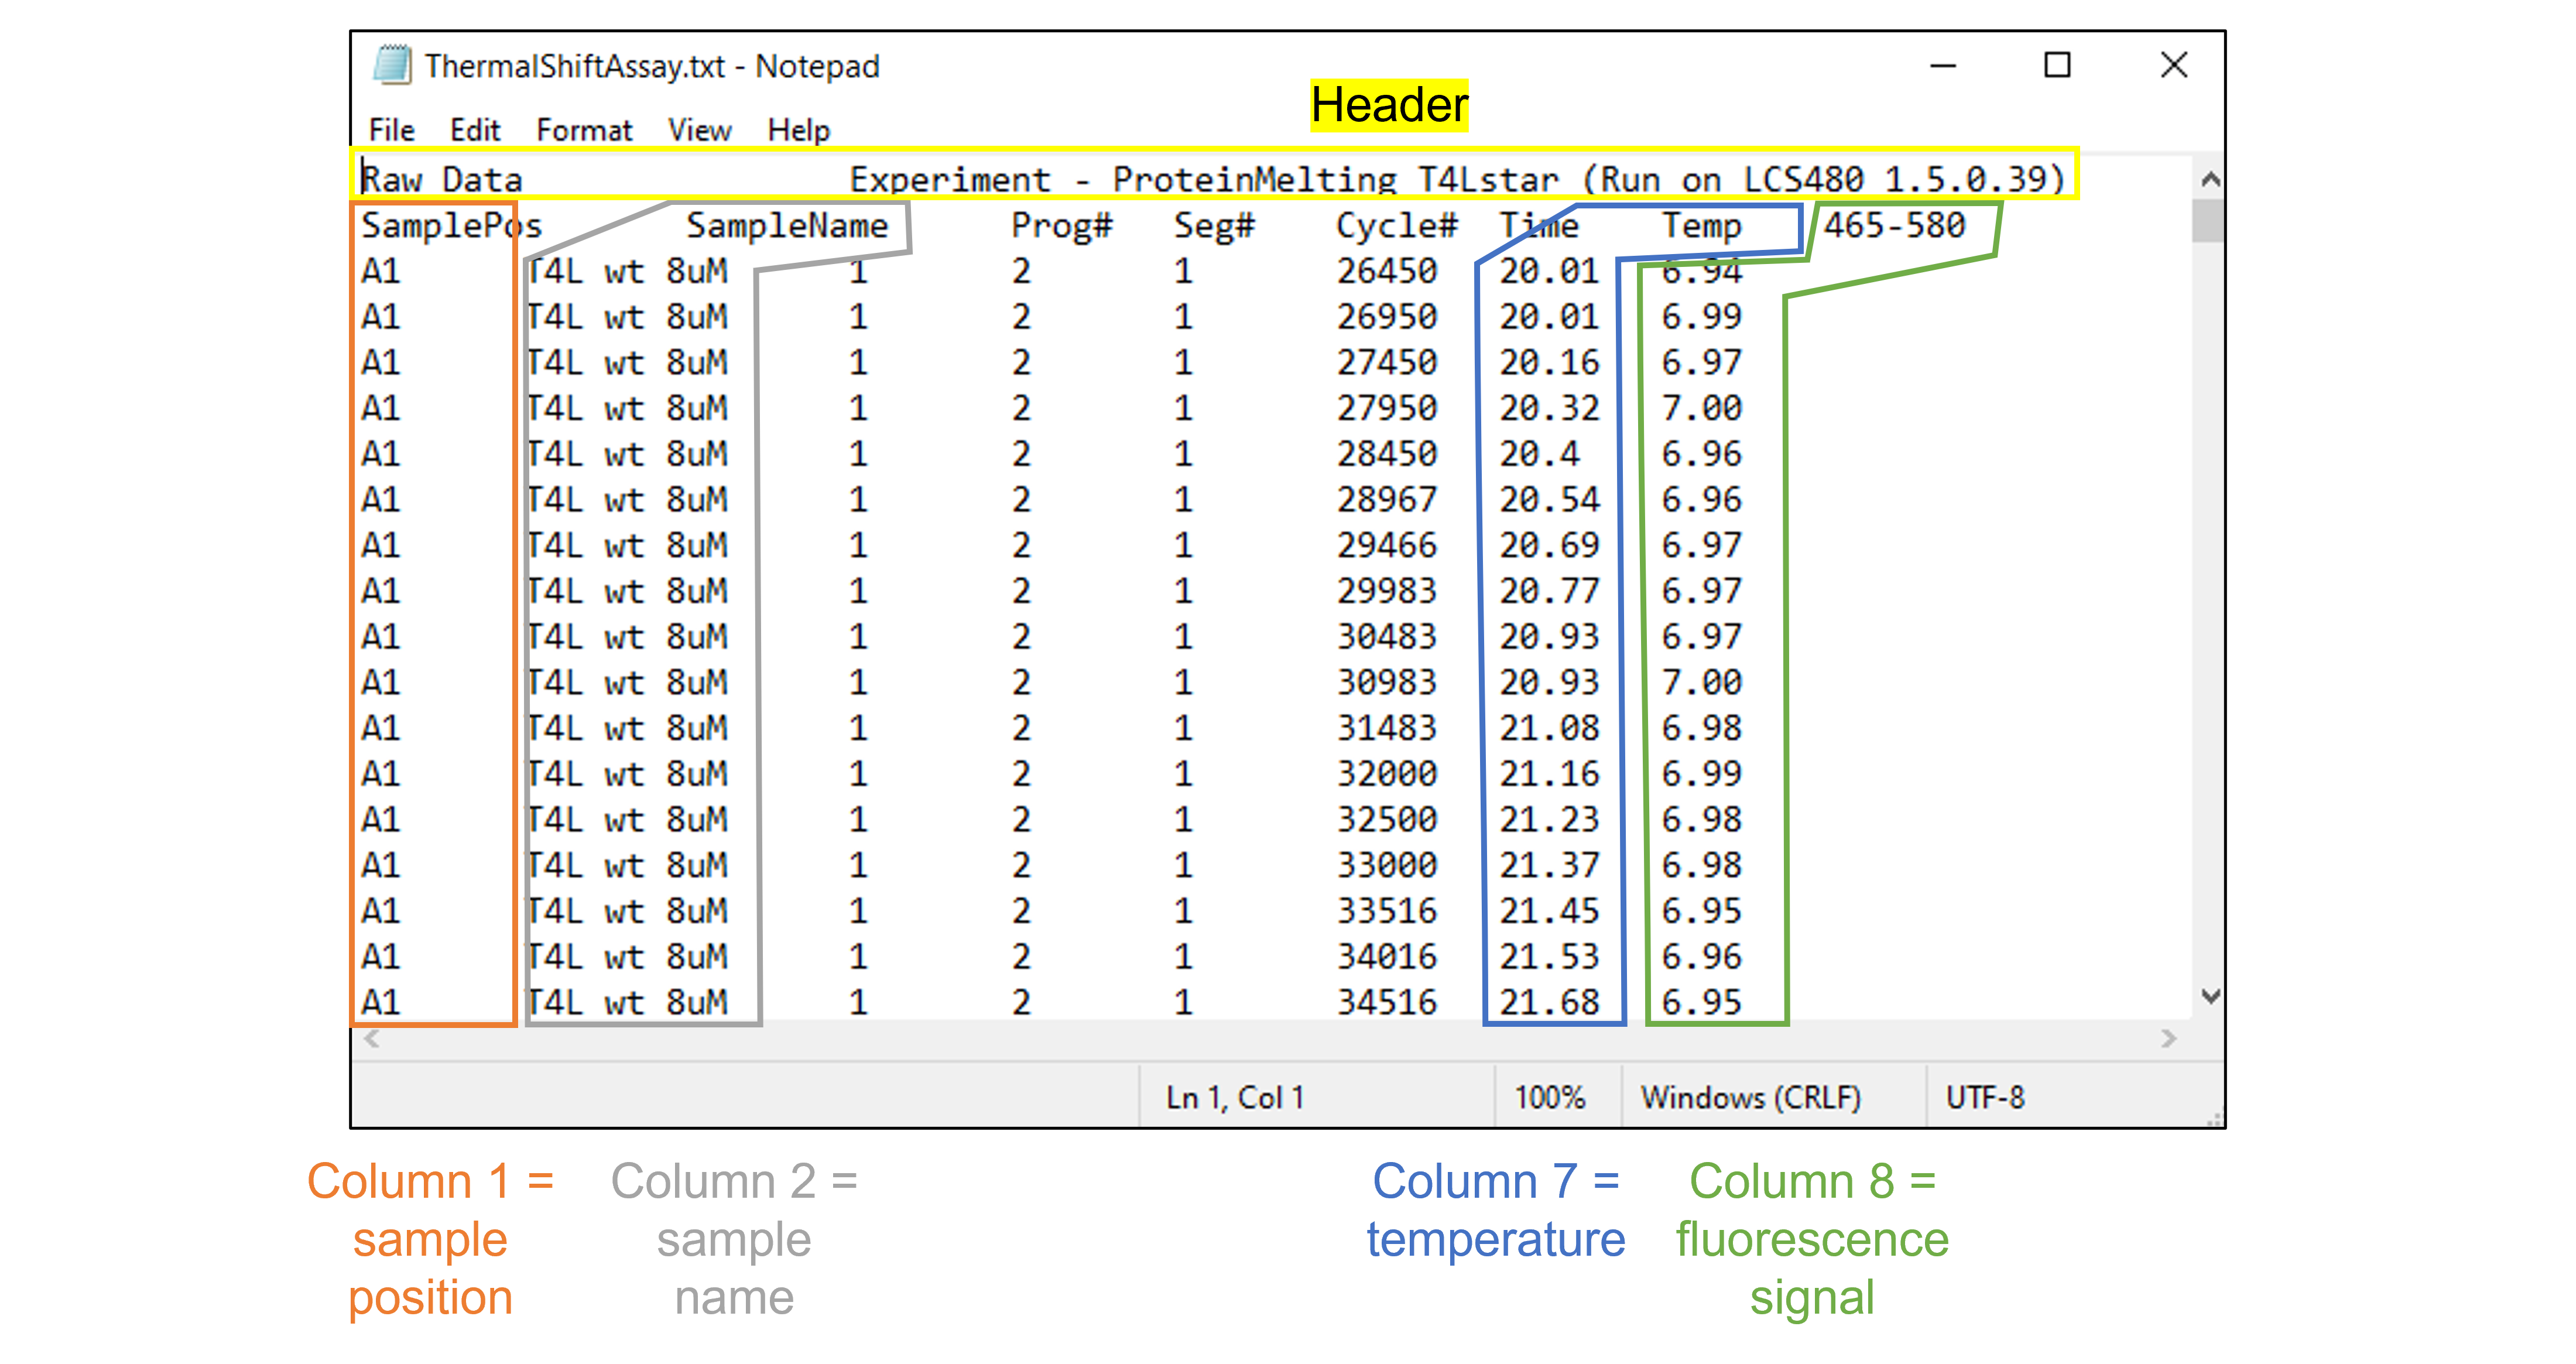
The data file contains a header with the experiment name, and 8 columns. We only read in columns 1, 2, 7 and 8, i.e. the sample position, the sample name, the temperature and the fluorescence signal. This is demonstrated in the figure below:
df = pd.read_csv('../data/ThermalShiftAssay.txt', skiprows=1, sep='\t', usecols=[0, 1, 6, 7])
# We use pd.read_csv to read in the file and store the information in a new dataframe, i.e. df.
# We use skiprows=1 to skip the first row.
# We use sep='\t' to specify that we have a tab-delimited text format.
# We use usecols=[0, 1, 6, 7] to only read in columns 1, 2, 7, and 8.
print(df)
      SamplePos  SampleName   Temp  465-580
0            A1  T4L wt 8uM  20.01     6.94
1            A1  T4L wt 8uM  20.01     6.99
2            A1  T4L wt 8uM  20.16     6.97
3            A1  T4L wt 8uM  20.32     7.00
4            A1  T4L wt 8uM  20.40     6.96
...         ...         ...    ...      ...
61915       H12       Empty  84.47     4.32
61916       H12       Empty  84.59     4.35
61917       H12       Empty  84.67     4.34
61918       H12       Empty  84.76     4.35
61919       H12       Empty  84.88     4.33

[61920 rows x 4 columns]
dfa1 = df[df['SamplePos']=='A1']
# We select all rows that contain A1 as sample position and store them in a new dataframe, i.e. dfa1.
print(dfa1)
    SamplePos  SampleName   Temp  465-580
0          A1  T4L wt 8uM  20.01     6.94
1          A1  T4L wt 8uM  20.01     6.99
2          A1  T4L wt 8uM  20.16     6.97
3          A1  T4L wt 8uM  20.32     7.00
4          A1  T4L wt 8uM  20.40     6.96
..        ...         ...    ...      ...
640        A1  T4L wt 8uM  84.47    78.21
641        A1  T4L wt 8uM  84.59    77.87
642        A1  T4L wt 8uM  84.67    77.57
643        A1  T4L wt 8uM  84.76    77.29
644        A1  T4L wt 8uM  84.88    76.92

[645 rows x 4 columns]
Plot “fluorescence (= \(y\)) versus temperature (= \(x\))” data from well A1#
We plot fluorescence versus temperature. We need to convert the temperature from °C to °K.
xdfa1=dfa1['Temp'] + 273.15
# We select the temperature = x and convert it from °C to °K, the result is stored in a new dataframe, i.e. xdfa1.

ydfa1=dfa1['465-580']
# We select the fluorescence signal = y, the result is stored in a new dataframe, i.e. ydfa1.

# We now plot the graph "fluorescence signal" versus "temperature".
plt.figure(figsize=(7,5))
plt.plot(xdfa1, ydfa1, 'o', color='gray', markersize=8)
plt.title('Thermal Shift Assay', fontsize=18)
plt.xlabel('T (°K)', fontsize=14)
plt.ylabel('Fluorescence (AU)', fontsize=14)
plt.show()
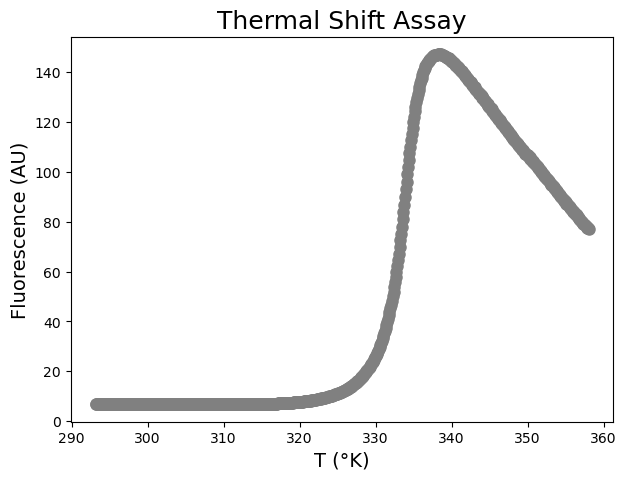
We see the typical sigmoidal transition.
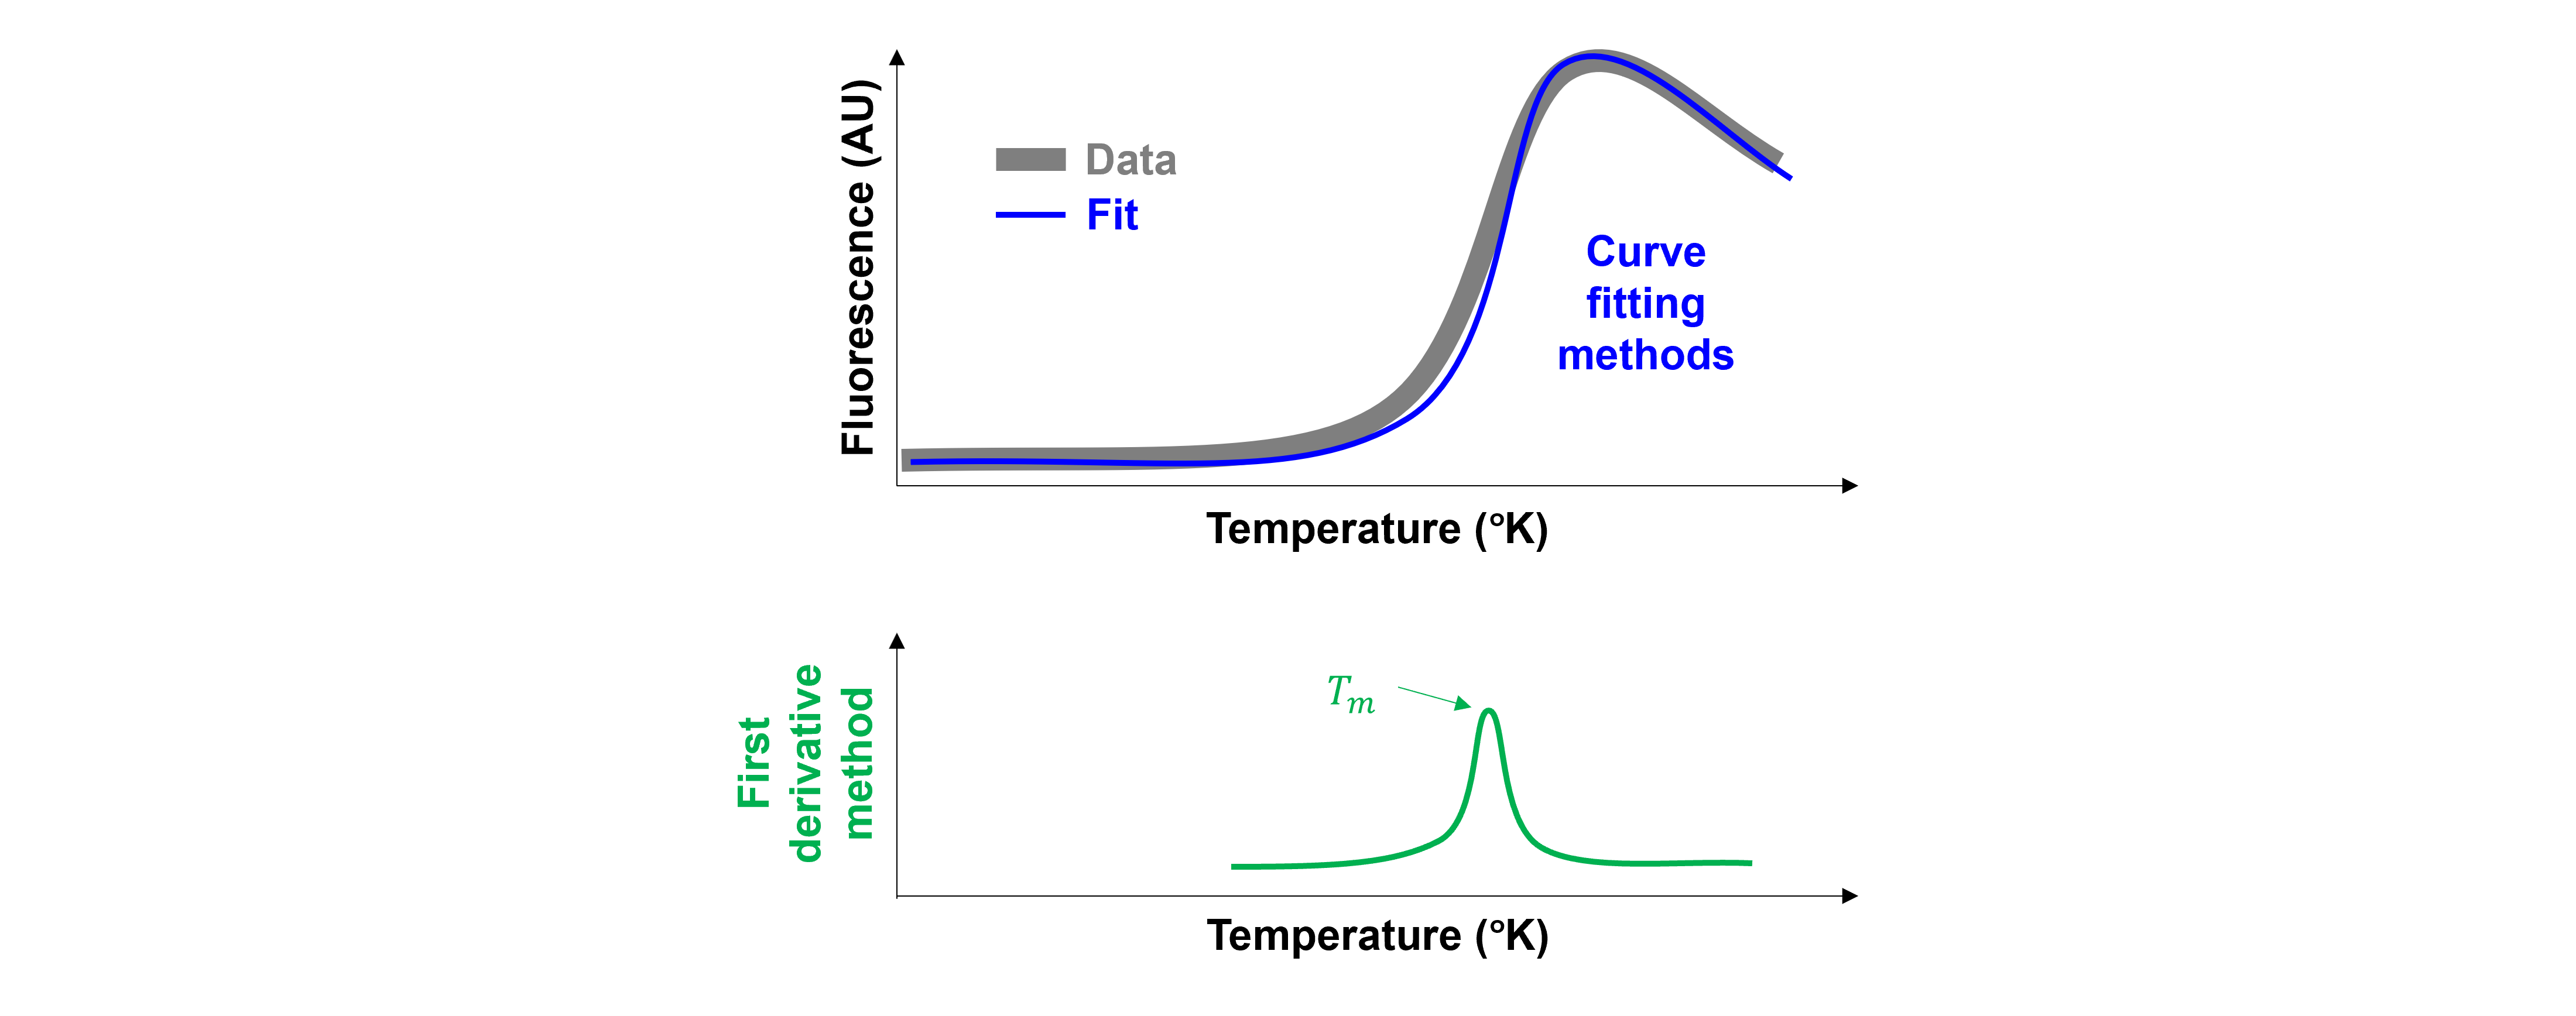
There are multiple ways to extract \(T_m\) (= the midpoint of the transition = the inflection point of the sigmoidal curve):
The first derivative method
Curve-fitting methods. A sigmoidal function is used to fit the protein melting curve. Curve-fitting methods are known to be more robust and less sensitive to random noise than the first-derivative method. Multiple functions are used:
A Boltzmann model
The equation describing the unfolding of a monomer via a two-state mechanism
The difference between both methods is demonstrated in the figure below:
Analysis: 1. First derivative method#
The first derivative of a function is the slope of the tangent line for any point on the function. It informs us when the function is increasing, decreasing, or constant.
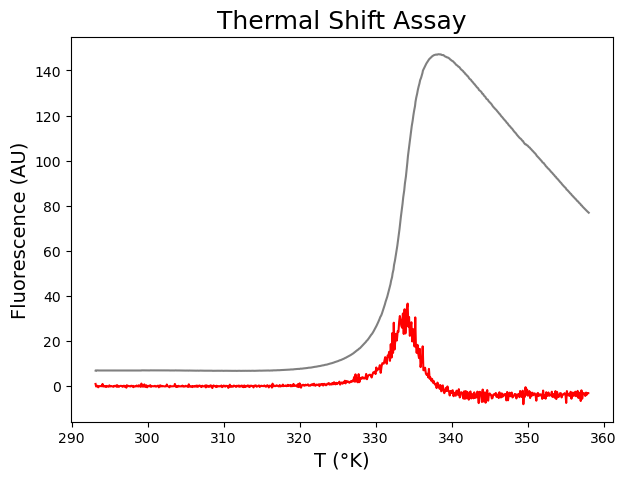
A sigmoidal function has a bell-shaped first derivative. At the inflection point of the sigmoidal curve, the tangent has the steepest slope and the first derivative has its maximum.
The first-derivative method determines the midpoint of the transition (= the inflection point of the sigmoidal curve = \(T_m\)) by searching for the peak of the first-derivative curve.
In the following calculations, we work with Numpy arrays. To see why, try the following command and look at both outputs:
print(np.array(xdfa1))
print(xdfa1)
[293.16 293.16 293.31 293.47 293.55 293.69 293.84 293.92 294.08 294.08
 294.23 294.31 294.38 294.52 294.6  294.68 294.83 294.91 295.05 295.12
 295.19 295.34 295.41 295.49 295.56 295.7  295.84 295.91 295.98 296.05
 296.2  296.27 296.34 296.49 296.56 296.68 296.75 296.83 296.96 297.03
 297.18 297.24 297.31 297.44 297.51 297.58 297.71 297.78 297.92 298.05
 298.11 298.18 298.38 298.44 298.51 298.64 298.71 298.83 298.9  299.02
 299.16 299.22 299.35 299.48 299.55 299.6  299.79 299.92 299.98 300.1
 300.17 300.3  300.41 300.48 300.54 300.66 300.78 300.91 301.03 301.09
 301.2  301.32 301.45 301.51 301.63 301.68 301.8  301.92 302.03 302.1
 302.15 302.33 302.45 302.51 302.55 302.68 302.85 302.91 303.03 303.08
 303.2  303.36 303.47 303.59 303.59 303.7  303.81 303.92 304.02 304.14
 304.25 304.36 304.42 304.53 304.64 304.74 304.85 304.96 305.07 305.12
 305.28 305.39 305.45 305.54 305.65 305.76 305.87 305.92 306.02 306.13
 306.22 306.34 306.44 306.54 306.64 306.75 306.85 306.94 307.05 307.15
 307.25 307.36 307.46 307.56 307.62 307.71 307.85 307.96 308.06 308.16
 308.26 308.36 308.49 308.55 308.65 308.74 308.85 308.99 309.04 309.14
 309.23 309.32 309.47 309.56 309.66 309.76 309.85 309.98 310.08 310.17
 310.27 310.37 310.5  310.6  310.64 310.78 310.87 310.97 311.1  311.2
 311.29 311.37 311.47 311.6  311.69 311.79 311.88 311.96 312.06 312.14
 312.27 312.41 312.5  312.59 312.68 312.81 312.89 312.98 313.11 313.2
 313.29 313.37 313.47 313.59 313.67 313.81 313.89 313.98 314.11 314.2
 314.28 314.4  314.53 314.61 314.7  314.79 314.91 315.   315.12 315.2
 315.32 315.41 315.54 315.62 315.71 315.78 315.9  315.99 316.11 316.19
 316.32 316.4  316.48 316.64 316.72 316.84 316.92 317.   317.12 317.24
 317.32 317.44 317.51 317.64 317.76 317.83 317.92 318.03 318.14 318.23
 318.34 318.42 318.47 318.62 318.72 318.81 318.92 319.   319.16 319.23
 319.31 319.43 319.53 319.65 319.73 319.84 319.96 320.04 320.15 320.21
 320.33 320.44 320.52 320.67 320.74 320.83 320.93 321.04 321.15 321.26
 321.37 321.49 321.56 321.66 321.74 321.85 321.95 322.03 322.14 322.25
 322.37 322.46 322.57 322.64 322.75 322.87 322.97 323.04 323.15 323.25
 323.36 323.47 323.58 323.69 323.79 323.89 323.96 324.07 324.17 324.28
 324.35 324.49 324.57 324.66 324.77 324.87 324.98 325.08 325.19 325.26
 325.39 325.49 325.6  325.7  325.81 325.91 325.98 326.11 326.18 326.31
 326.39 326.49 326.59 326.7  326.79 326.92 327.02 327.13 327.19 327.33
 327.37 327.5  327.59 327.73 327.79 327.93 328.03 328.13 328.2  328.29
 328.39 328.49 328.59 328.72 328.79 328.92 329.02 329.11 329.21 329.31
 329.41 329.54 329.64 329.73 329.83 329.92 330.05 330.12 330.22 330.32
 330.41 330.51 330.6  330.73 330.83 330.93 331.02 331.12 331.22 331.3
 331.41 331.53 331.62 331.73 331.82 331.95 332.03 332.16 332.23 332.35
 332.42 332.54 332.64 332.73 332.85 332.95 333.05 333.14 333.23 333.32
 333.43 333.54 333.63 333.76 333.85 333.98 334.08 334.17 334.25 334.35
 334.44 334.56 334.66 334.75 334.87 334.96 335.06 335.18 335.24 335.34
 335.46 335.55 335.65 335.76 335.85 335.98 336.07 336.16 336.22 336.34
 336.45 336.55 336.67 336.76 336.86 336.98 337.04 337.16 337.25 337.36
 337.49 337.58 337.67 337.8  337.88 337.96 338.08 338.18 338.27 338.39
 338.45 338.57 338.68 338.78 338.89 338.98 339.08 339.2  339.28 339.4
 339.49 339.61 339.7  339.79 339.88 339.97 340.06 340.2  340.29 340.41
 340.5  340.59 340.68 340.8  340.88 341.   341.12 341.21 341.3  341.42
 341.51 341.59 341.7  341.8  341.92 342.   342.13 342.21 342.29 342.41
 342.53 342.62 342.71 342.83 342.91 343.03 343.11 343.23 343.32 343.44
 343.53 343.59 343.71 343.81 343.94 344.02 344.14 344.23 344.32 344.43
 344.49 344.6  344.75 344.84 344.93 345.07 345.14 345.24 345.33 345.42
 345.54 345.65 345.75 345.86 345.95 346.03 346.15 346.23 346.33 346.44
 346.53 346.65 346.72 346.84 346.96 347.05 347.16 347.23 347.37 347.45
 347.57 347.66 347.77 347.84 347.95 348.04 348.13 348.24 348.35 348.47
 348.56 348.67 348.77 348.88 348.96 349.05 349.17 349.28 349.4  349.46
 349.58 349.66 349.77 349.86 349.98 350.07 350.15 350.28 350.36 350.47
 350.59 350.68 350.76 350.86 350.97 351.1  351.17 351.29 351.4  351.5
 351.58 351.7  351.79 351.87 351.95 352.11 352.19 352.31 352.4  352.49
 352.57 352.66 352.8  352.93 353.01 353.13 353.22 353.31 353.42 353.51
 353.6  353.71 353.81 353.92 354.01 354.12 354.21 354.3  354.41 354.51
 354.6  354.71 354.8  354.91 355.03 355.1  355.21 355.3  355.4  355.51
 355.59 355.71 355.8  355.92 356.01 356.1  356.22 356.31 356.42 356.51
 356.63 356.72 356.81 356.94 357.01 357.13 357.2  357.32 357.43 357.53
 357.62 357.74 357.82 357.91 358.03]
0      293.16
1      293.16
2      293.31
3      293.47
4      293.55
        ...
640    357.62
641    357.74
642    357.82
643    357.91
644    358.03
Name: Temp, Length: 645, dtype: float64
The essential difference is the presence of the index: while the Numpy array has an implicitly defined integer index used to access the values, the Pandas series has an explicitly defined index associated with the values.
To calculate the derivative of our fluorescence (= \(y\)) versus temperature (= \(x\)) data, we subtract two adjacent elements in \(y\), and divide by the difference in the two corresponding elements in \(x\). This is represented with the following formula:
Note that this approximated derivative has size \(n-1\) with \(n\) being our amount of data points.
We use the numpy.diff and numpy.divide functions.
outa1 = np.ones( (len(np.array(ydfa1)) -1) )
derya1 = np.divide(np.diff(np.array(ydfa1)), np.diff(np.array(xdfa1)), out=outa1, where=np.diff(np.array(xdfa1))!=0)
# The np.diff function calculates the n-th discrete difference. When n = 1 (default), np.diff calculates the difference between subsequent elements in our array, and returns an array that is one element shorter.
# The np.divide function returns a division of the inputs. To prevent division by zero, we can take advantage of the "where" option.
# We pre-initialize the output 'outa1' that we will use when the "divide by zero encountered" error happens. The input of 'out=' needs to be an array.
# To create the array 'outa1', we use the np.ones function which returns an array of given shape (i.e. n-1 data points, the 'len()' function gives us n) and type, filled with ones.

derxa1 = (np.array(xdfa1)[:-1] + np.array(xdfa1)[1:]) / 2
# The derivative is of size n-1, and is evaluated at the midpoints. The x data for the derivative can be calculated via (all but the last elements of x (represented by x[:-1]) + all but the first element of x (represented by x[1:])) / 2.

# We now plot the graph "fluorescence signal" versus "temperature" and add the calculated first derivative to it.
plt.figure(figsize=(7,5))
plt.plot(xdfa1, ydfa1, color='gray')
plt.plot(derxa1, derya1, color='red')
plt.title('Thermal Shift Assay', fontsize=18)
plt.xlabel('T (°K)', fontsize=14)
plt.ylabel('Fluorescence (AU)', fontsize=14)
plt.show()
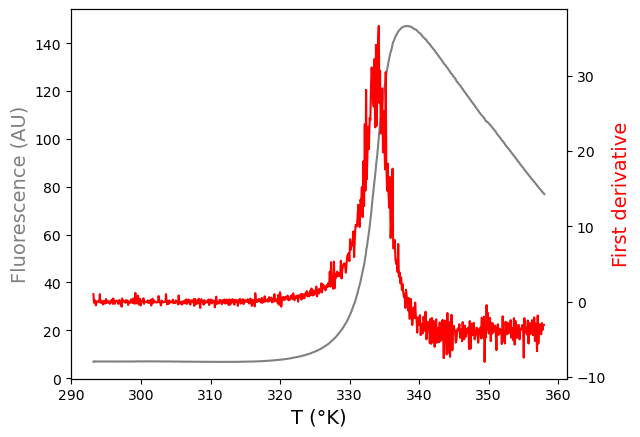
Ok, but I want to pimp my graph by (1) using a secondary Y-axis and (2) smoothing the first derivative curve.
Tip: How to make a plot with a secondary Y-axis?#
A secondary Y-axis is a Y-axis drawn on the right-hand side of the graph. The primary Y-axis is on the left-hand side of the graph. You can use a secondary Y-axis with a different scale than the primary Y-axis to plot a series of data on a different scale. This lets you compare two series of data more easily on the same graph.
Use the matplotlib.pyplot.subplots and the matplotlib.axes.Axes.twinx functions to create a secondary Y-axis.
fig,ax = plt.subplots()
# create figure and axis objects with subplots()

ax.plot(xdfa1, ydfa1, color='gray')
# make a plot

ax.set_xlabel('T (°K)', fontsize=14)
ax.set_ylabel('Fluorescence (AU)',color="gray",fontsize=14)
# set x- and y-axis labels

ax2=ax.twinx()
# instantiate a second axes that shares the same x-axis

ax2.plot(derxa1, derya1, color='red')
# make a plot with different y-axis using second axis object

ax2.set_ylabel('First derivative',color="red",fontsize=14)
# set y-axis label for the second axis object

plt.show()
Tip: How to smoothen a curve?#
Smoothing is usually done to help us see patterns in data series. We smooth out the roughness to see a clearer signal. How? The data points are modified so that points higher than the adjacent points (presumably because of noise) are reduced, and points lower than the adjacent points (presumably because of noise) are increased.
You can smooth data several ways in Python. Have a look at the scipy.ndimage.uniform_filter1d function for a moving average filter and the scipy.signal.savgol_filter function for a Savitzky-Golay filter.
A moving average filter is the simplest filter to understand and use. It is commonly used to smooth out short-term fluctuations. For example, using a filer of length 3, the new, smoothed point \(x\) is the average of the old points \(x-1\), \(x\), and \(x+1\).
A Savitzky-Golay filter uses least squares to regress a small window of the data onto a polynomial, then uses the polynomial to estimate the point in the center of the window. Finally the window is shifted forward by one data point and the process repeats. This continues until every point has been optimally adjusted relative to its neighbours.
The example below shows the difference between both methods:
xtestsmooth = [0,1,2,3,4,5,6,7,8]
ytestsmooth = [2, 2, 5, 2, 1, 0, 1, 4, 9]
plt.figure(figsize=(7,5))
plt.plot(xtestsmooth, ytestsmooth, '-o', color='gray', markersize=8, label='Original')
plt.plot(xtestsmooth, uniform_filter1d(ytestsmooth, size=3), '-o', color='red', markersize=8, label='Moving average') # length of filter is 3
plt.plot(xtestsmooth, savgol_filter(ytestsmooth, 5, 3), '-o', color='blue', markersize=8, label='Savitzky-Golay') # window size is 5, polynomial order is 3
plt.title('Smoothing', fontsize=18)
plt.xlabel('Index', fontsize=14)
plt.ylabel('Value', fontsize=14)
plt.legend(loc='upper left')
plt.show()
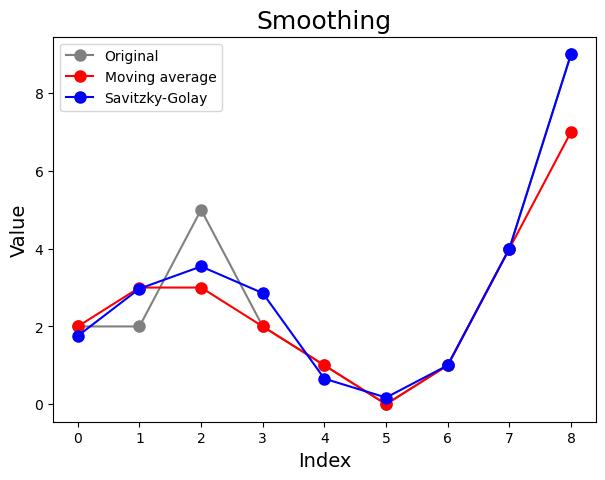
A Saviztky-Golay filter is often better than a moving average filter because it tends to preserve features of the data which are usually attenuated by a moving average filter, i.e. area, position and width of peaks. A moving average filter can produce significant distortions and reduce the signal intensity, with the subsequent loss of adjacent small signals. Off course, all depends on the filter size, window size and polynomial order used.
Back to our data, now with a secondary Y-axis and a smooth first derivative:
fig,ax = plt.subplots()
ax.plot(xdfa1, ydfa1, color='gray')
ax.set_xlabel('T (°K)', fontsize=14)
ax.set_ylabel('Fluorescence (AU)',color="gray",fontsize=14)
ax2=ax.twinx()
ax2.plot(derxa1, savgol_filter(derya1, 21, 3), color='red')
ax2.set_ylabel('First derivative',color="red",fontsize=14)
plt.show()
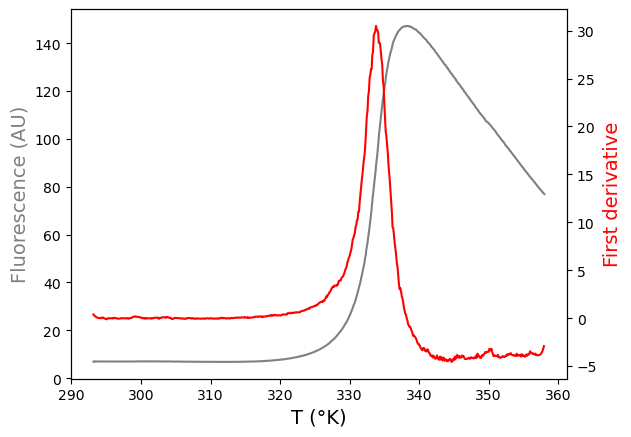
That looks much better!
We now need to find the y-value for the peak in the first derivative signal (i.e. the maximum value) and its corresponding x-value, which is the \(T_m\) we are looking for.
max_derya1 = np.max(derya1)
# find the maximum y value

max_derxa1 = derxa1[derya1.argmax()]
# find the x value corresponding to the maximum y value

print(max_derxa1, max_derya1)
334.21 36.62499999998117
The \(T_m\) is 334 °K.
Analysis: 2. Curve-fitting using a Boltzmann model#
Using the Boltzmann equation:
where \(Y\) is the observed fluorescence intensity, \(Y_{min}\) and \(Y_{max}\) are pretransitional and posttransitional fluorescence intensities, and \(a\) is a slope factor. \(T\) is the temperature and \(T_m\) is the midpoint of the thermal unfolding curve.
# We define the function to fit the data.
def funcBoltzmann(x, Ymin, Ymax, Tm, a):

    return Ymin + ((Ymax) - Ymin)/(1 + np.exp((Tm-x)/a))
We test input parameters for scipy.optimize.curve_fit based on visual inspection (see figure below), this involves trial and error.

# We plot our curve with initial guesses for the parameters onto the data. Change these guesses if needed.
# Note that we first create a list of temperatures as input for our function using the numpy.linspace command.

xin = np.linspace(290, 360, 200)

plt.figure(figsize=(7,5))
plt.plot(xdfa1, ydfa1, 'o', color='gray', markersize=8)
plt.plot(xin, funcBoltzmann(xin, 10, 150, 333, 5), color="red",label='Guess')
plt.title('Thermal Shift Assay', fontsize=18)
plt.xlabel('T (°K)', fontsize=14)
plt.ylabel('Fluorescence (AU)', fontsize=14)
plt.show()
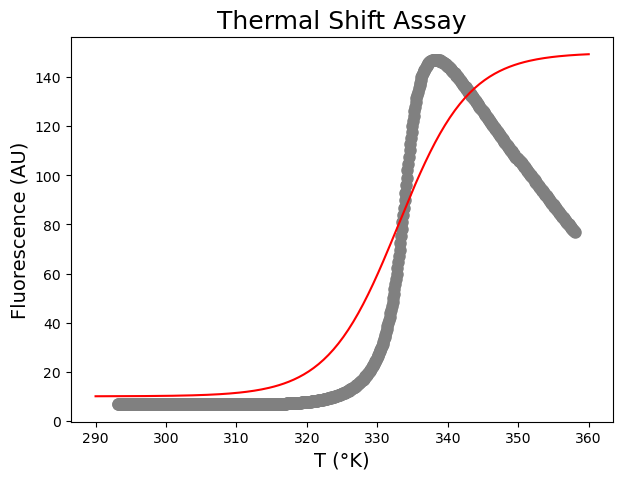
Looks ok. We can now run scipy.optimize.curve_fit and plot the resulting curve on the data.
# We fit the data.
paramsBoltzmann, params_covarianceBoltzmann = curve_fit(funcBoltzmann, xdfa1, ydfa1,
                                               [ 10, 150, 333, 5], maxfev=10000)

# We print the fitted parameters.
print(paramsBoltzmann)
print(np.sqrt(np.diag(params_covarianceBoltzmann)))

# We plot the fitted curve onto the data.
plt.figure(figsize=(7,5))
plt.plot(xdfa1, ydfa1, 'o', color='gray', markersize=8)
plt.plot(xin, funcBoltzmann(xin, *paramsBoltzmann), color="red",label='Fit')
plt.title('Thermal Shift Assay', fontsize=18)
plt.xlabel('T (°K)', fontsize=14)
plt.ylabel('Fluorescence (AU)', fontsize=14)
plt.show()
[  8.46641251 117.38342176 332.50319245   0.96940869]
[0.72752489 0.92834356 0.10142863 0.08840673]
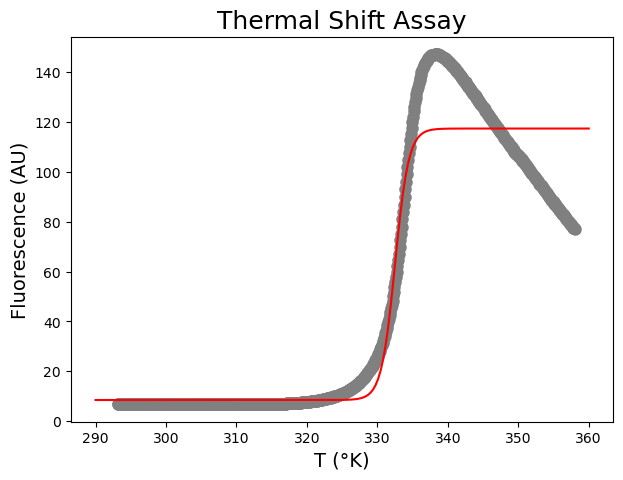
This does not look good! The Boltzmann function does not take post-peak fluorescence into account, often observed in TSAs due to protein aggregation and dye dissociation at higher temperatures. We can include an empirical term to model fluorescence decrease with temperature after peak fluorescence:
where \(Y\) is the observed fluorescence intensity, \(Y_{min}\) and \(Y_{max}\) are pretransitional and posttransitional fluorescence intensities, \(a\) is a slope factor for the transition, and \(b\) accounts for the decrease in \(Y\) after peak fluorescence. \(T\) is the temperature and \(T_m\) is the midpoint of the thermal unfolding curve.
As this is an empirical model, multiple options to include fluorescence decrease with temperature after peak fluorescence are possible!
Let’s see if this works:
# We define the new function.
def funcBoltzmannEmpirical(x, Ymin, Ymax, Tm, a, b):

    return Ymin + ((Ymax - b*(x - Tm) - Ymin)/(1 + np.exp((Tm-x)/a)))

# We fit the data.
paramsBoltzmannEmpirical, params_covarianceBoltzmannEmpirical = curve_fit(funcBoltzmannEmpirical, xdfa1, ydfa1,
                                               [10, 150, 333, 5, 2], maxfev=10000)
# We print the fitted parameters.
print(paramsBoltzmannEmpirical)
print(np.sqrt(np.diag(params_covarianceBoltzmannEmpirical)))

# We plot the fitted curve onto the data.
plt.figure(figsize=(7,5))
plt.plot(xdfa1, ydfa1, 'o', color='gray', markersize=8)
plt.plot(xin, funcBoltzmannEmpirical(xin, *paramsBoltzmannEmpirical), color="blue",label='Fit')
plt.title('Thermal Shift Assay', fontsize=18)
plt.xlabel('T (°K)', fontsize=14)
plt.ylabel('Fluorescence (AU)', fontsize=14)
plt.show()
[  7.85990258 171.68481688 333.74524363   1.52565204   3.97356596]
[0.09701873 0.33837075 0.01447148 0.0111816  0.0236133 ]
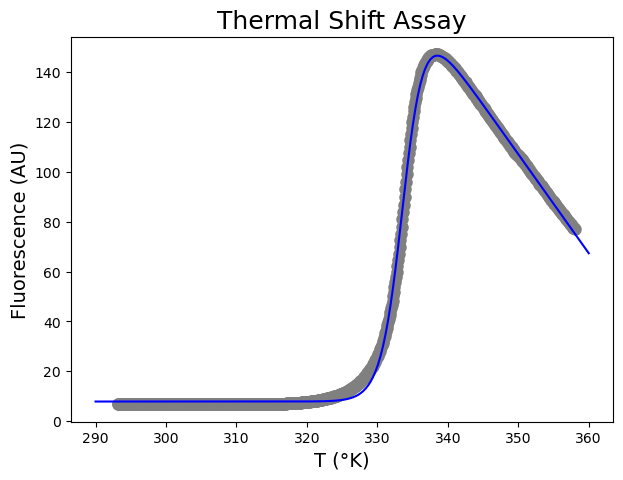
The \(T_m\) is 333.75 \(\pm\) 0.01 °K.
Analysis: 3. Curve-fitting using the equation describing the unfolding of a monomer via a two-state mechanism#
Using the equation describing the unfolding of a monomer via a two-state mechanism:
where \(Y\) is the observed fluorescence intensity, \(m_n\) and \(m_u\) account for changes in the signals of the pre- and post-transition regions with changes in temperature and \(Y_{n'}\) and \(Y_{u'}\) are the signal of the native and unfolded states. \(T\) is the temperature, \(T_m\) is the midpoint of the thermal unfolding curve, \(\Delta H_m\) is the enthalpy change for protein unfolding at \(T_m\) and \(\Delta C_p\) is the change in heat capacity.
def funcUF(x, yn, mn, yu, mu, DHm, Tm, DCp):

    return ((yn + mn * x) + (yu + mu * x) * np.exp((DHm * ((x / Tm) - 1) + DCp * (Tm - x + x * np.log(x / Tm))) / (8.314 * x))) / (1 + np.exp((DHm * ((x / Tm) - 1) + DCp * (Tm - x + x * np.log(x / Tm))) / (8.314 * x)))
First, test input parameters for scipy.optimize.curve_fit based on visual inspection. I usually start with a \(\Delta H_m\)-value around 300 kJ mol\(^{-1}\) and a \(\Delta C_p\)-value around 10 kJ mol\(^{−1}\) K\(^{-1}\). Finding good guesses involves trial and error, I included my final result.
plt.figure(figsize=(7,5))
plt.plot(xdfa1, ydfa1, 'o', color='gray', markersize=8)
plt.plot(xin, funcUF(xin, 6, -0.01, 150, 0.02, 402000, 330, 6000), color="red",label='Fit')
plt.title('Thermal Shift Assay', fontsize=18)
plt.xlabel('T (°K)', fontsize=14)
plt.ylabel('Fluorescence (AU)', fontsize=14)
plt.show()
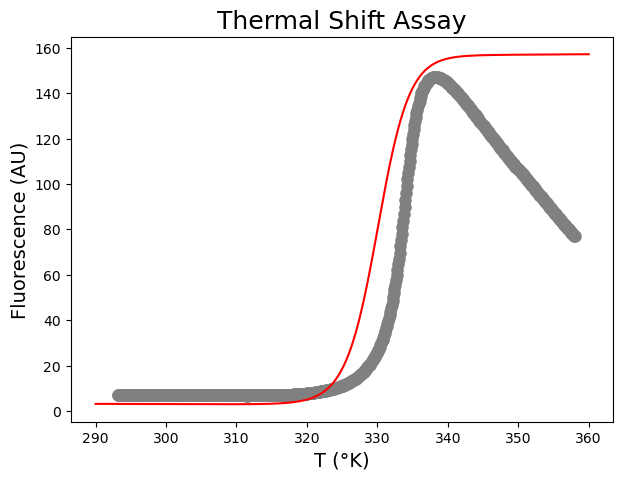
Second, run scipy.optimize.curve_fit and plot the resulting curve on the data.
paramsUF, params_covarianceUF = curve_fit(funcUF, xdfa1, ydfa1,
                                               [6, -0.01, 150, 0.02, 402000, 330, 6000], maxfev=10000)

print(paramsUF)
print(np.sqrt(np.diag(params_covarianceUF)))

plt.figure(figsize=(7,5))
plt.plot(xdfa1, ydfa1, 'o', color='gray', markersize=8)
plt.plot(xin, funcUF(xin, *paramsUF), color="red",label='Fit')
plt.title('Thermal Shift Assay', fontsize=18)
plt.xlabel('T (°K)', fontsize=14)
plt.ylabel('Fluorescence (AU)', fontsize=14)
plt.show()
[-3.60741800e+01  1.40218168e-01  1.46004700e+03 -3.86614730e+00
  6.48921008e+05  3.33813581e+02  2.63591358e+04]
[2.16781537e+00 6.94593293e-03 4.86727186e+00 1.39736487e-02
 3.32159245e+03 9.06504468e-03 2.19021576e+02]
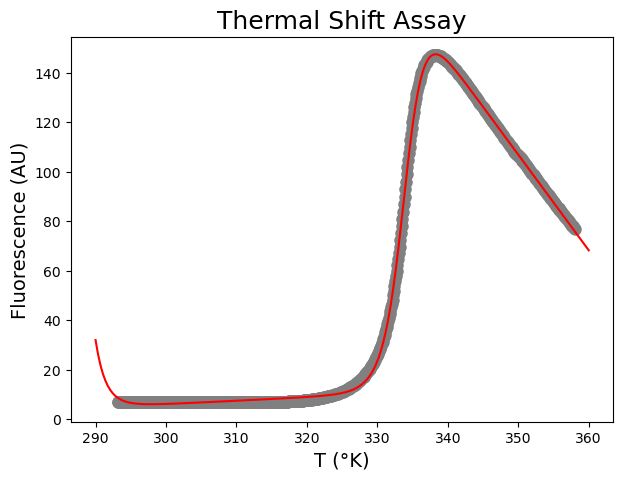
From this fit, we can conclude that \(\Delta H_m\) is 649 \(\pm\) 3 kJ mol\(^{-1}\) K\(^{-1}\), \(\Delta C_p\) 26.4 \(\pm\) 0.2 kJ mol\(^{−1}\) K\(^{-1}\) and that \(T_m\) is 333.81 \(\pm\) 0.01 K.
Advice: Overfitting#
Overfitting happens when the model is too complex for the data. In our case, can we justify the use of all parameters?
When the enthalpy and entropy are temperature independent, we can write:
Now we only have 6 variables… Let us see if that works:
def funcUFnoDCp(x, yn, mn, yu, mu, DHm, Tm):

    return ((yn + mn * x) + (yu + mu * x) * np.exp((DHm / 8.314) * ((1 / Tm) - (1 / x)))) / (1 + np.exp((DHm / 8.314) * ((1 / Tm) - (1 / x))))
paramsUFnoDCp, params_covarianceUFnoDCp = curve_fit(funcUFnoDCp, xdfa1, ydfa1,
                                               [6, -0.01, 150, 0.02, 402000, 330], maxfev=10000)

print(paramsUFnoDCp)
print(np.sqrt(np.diag(params_covarianceUFnoDCp)))

plt.figure(figsize=(7,5))
plt.plot(xdfa1, ydfa1, 'o', color='gray', markersize=8)
plt.plot(xin, funcUF(xin, *paramsUF), color="red",label='Change in heat capacity')
plt.plot(xin, funcUFnoDCp(xin, *paramsUFnoDCp), color="blue",label='Change in heat capacity = 0')
plt.title('Unfolding', fontsize=18)
plt.xlabel('T (°K)', fontsize=14)
plt.ylabel('$\\Delta$$A_{286nm}$ (AU) x 100', fontsize=14)
plt.legend(loc='upper left')
plt.show()
[-3.87419869e+01  1.50303538e-01  1.48440857e+03 -3.93535895e+00
  6.41886743e+05  3.33812832e+02]
[2.47012998e+00 7.94675118e-03 6.88836674e+00 1.97610448e-02
 4.46184075e+03 1.24515726e-02]
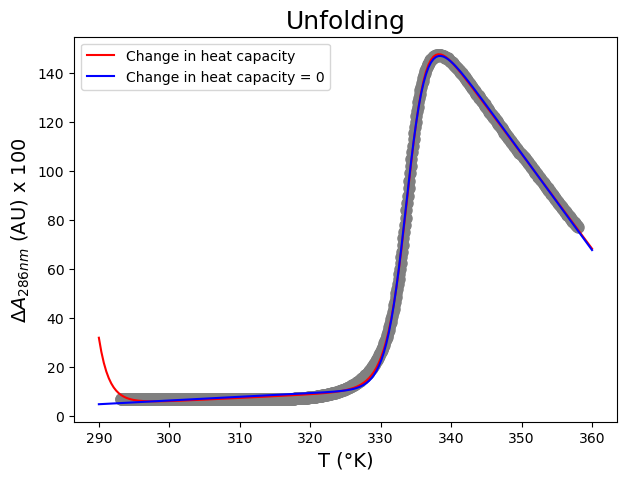
From this fit, we can conclude that \(\Delta H_m\) is 642 \(\pm\) 4 kJ mol\(^{-1}\) K\(^{-1}\) and that \(T_m\) is 333.81 \(\pm\) 0.01 K. Very similar to the previous fit…
And now for each well…#
Let’s have a look at all wells. We first group by SamplePos column and convert its result into a dictionary of DataFrames. More information on dictionaries and tuples in Python is available here.
dict_of_wells = dict(tuple(df.groupby("SamplePos")))
# We group by SamplePos column and convert its result into a dictionary of DataFrames.
print(dict_of_wells)
{'A1': SamplePos SampleName Temp 465-580
0 A1 T4L wt 8uM 20.01 6.94
1 A1 T4L wt 8uM 20.01 6.99
2 A1 T4L wt 8uM 20.16 6.97
3 A1 T4L wt 8uM 20.32 7.00
4 A1 T4L wt 8uM 20.40 6.96
.. ... ... ... ...
640 A1 T4L wt 8uM 84.47 78.21
641 A1 T4L wt 8uM 84.59 77.87
642 A1 T4L wt 8uM 84.67 77.57
643 A1 T4L wt 8uM 84.76 77.29
644 A1 T4L wt 8uM 84.88 76.92
[645 rows x 4 columns], 'A10': SamplePos SampleName Temp 465-580
5805 A10 Empty 20.01 5.22
5806 A10 Empty 20.01 5.23
5807 A10 Empty 20.16 5.20
5808 A10 Empty 20.32 5.19
5809 A10 Empty 20.40 5.20
... ... ... ... ...
6445 A10 Empty 84.47 3.11
6446 A10 Empty 84.59 3.13
6447 A10 Empty 84.67 3.12
6448 A10 Empty 84.76 3.09
6449 A10 Empty 84.88 3.11
[645 rows x 4 columns], 'A11': SamplePos SampleName Temp 465-580
6450 A11 Empty 20.01 6.95
6451 A11 Empty 20.01 6.93
6452 A11 Empty 20.16 6.91
6453 A11 Empty 20.32 6.91
6454 A11 Empty 20.40 6.88
... ... ... ... ...
7090 A11 Empty 84.47 4.02
7091 A11 Empty 84.59 4.02
7092 A11 Empty 84.67 4.03
7093 A11 Empty 84.76 4.04
7094 A11 Empty 84.88 4.01
[645 rows x 4 columns], 'A12': SamplePos SampleName Temp 465-580
7095 A12 Empty 20.01 7.11
7096 A12 Empty 20.01 7.06
7097 A12 Empty 20.16 7.08
7098 A12 Empty 20.32 7.09
7099 A12 Empty 20.40 7.05
... ... ... ... ...
7735 A12 Empty 84.47 4.14
7736 A12 Empty 84.59 4.11
7737 A12 Empty 84.67 4.10
7738 A12 Empty 84.76 4.11
7739 A12 Empty 84.88 4.11
[645 rows x 4 columns], 'A2': SamplePos SampleName Temp 465-580
645 A2 T4L wt 8uM 20.01 7.15
646 A2 T4L wt 8uM 20.01 7.12
647 A2 T4L wt 8uM 20.16 7.15
648 A2 T4L wt 8uM 20.32 7.12
649 A2 T4L wt 8uM 20.40 7.16
... ... ... ... ...
1285 A2 T4L wt 8uM 84.47 73.00
1286 A2 T4L wt 8uM 84.59 72.65
1287 A2 T4L wt 8uM 84.67 72.36
1288 A2 T4L wt 8uM 84.76 72.08
1289 A2 T4L wt 8uM 84.88 71.80
[645 rows x 4 columns], 'A3': SamplePos SampleName Temp 465-580
1290 A3 T4L wt 8uM 20.01 8.77
1291 A3 T4L wt 8uM 20.01 8.78
1292 A3 T4L wt 8uM 20.16 8.78
1293 A3 T4L wt 8uM 20.32 8.80
1294 A3 T4L wt 8uM 20.40 8.82
... ... ... ... ...
1930 A3 T4L wt 8uM 84.47 49.05
1931 A3 T4L wt 8uM 84.59 48.96
1932 A3 T4L wt 8uM 84.67 48.80
1933 A3 T4L wt 8uM 84.76 48.57
1934 A3 T4L wt 8uM 84.88 48.41
[645 rows x 4 columns], 'A4': SamplePos SampleName Temp 465-580
1935 A4 T4L wt 8uM 20.01 7.77
1936 A4 T4L wt 8uM 20.01 7.80
1937 A4 T4L wt 8uM 20.16 7.76
1938 A4 T4L wt 8uM 20.32 7.83
1939 A4 T4L wt 8uM 20.40 7.82
... ... ... ... ...
2575 A4 T4L wt 8uM 84.47 24.66
2576 A4 T4L wt 8uM 84.59 24.58
2577 A4 T4L wt 8uM 84.67 24.51
2578 A4 T4L wt 8uM 84.76 24.47
2579 A4 T4L wt 8uM 84.88 24.36
[645 rows x 4 columns], 'A5': SamplePos SampleName Temp 465-580
2580 A5 Empty 20.01 7.61
2581 A5 Empty 20.01 7.59
2582 A5 Empty 20.16 7.55
2583 A5 Empty 20.32 7.59
2584 A5 Empty 20.40 7.55
... ... ... ... ...
3220 A5 Empty 84.47 4.32
3221 A5 Empty 84.59 4.35
3222 A5 Empty 84.67 4.34
3223 A5 Empty 84.76 4.35
3224 A5 Empty 84.88 4.33
[645 rows x 4 columns], 'A6': SamplePos SampleName Temp 465-580
3225 A6 Empty 20.01 7.61
3226 A6 Empty 20.01 7.59
3227 A6 Empty 20.16 7.55
3228 A6 Empty 20.32 7.59
3229 A6 Empty 20.40 7.55
... ... ... ... ...
3865 A6 Empty 84.47 4.32
3866 A6 Empty 84.59 4.35
3867 A6 Empty 84.67 4.34
3868 A6 Empty 84.76 4.35
3869 A6 Empty 84.88 4.33
[645 rows x 4 columns], 'A7': SamplePos SampleName Temp 465-580
3870 A7 Empty 20.01 7.61
3871 A7 Empty 20.01 7.59
3872 A7 Empty 20.16 7.55
3873 A7 Empty 20.32 7.59
3874 A7 Empty 20.40 7.55
... ... ... ... ...
4510 A7 Empty 84.47 4.32
4511 A7 Empty 84.59 4.35
4512 A7 Empty 84.67 4.34
4513 A7 Empty 84.76 4.35
4514 A7 Empty 84.88 4.33
[645 rows x 4 columns], 'A8': SamplePos SampleName Temp 465-580
4515 A8 Empty 20.01 7.61
4516 A8 Empty 20.01 7.59
4517 A8 Empty 20.16 7.55
4518 A8 Empty 20.32 7.59
4519 A8 Empty 20.40 7.55
... ... ... ... ...
5155 A8 Empty 84.47 4.32
5156 A8 Empty 84.59 4.35
5157 A8 Empty 84.67 4.34
5158 A8 Empty 84.76 4.35
5159 A8 Empty 84.88 4.33
[645 rows x 4 columns], 'A9': SamplePos SampleName Temp 465-580
5160 A9 Empty 20.01 6.45
5161 A9 Empty 20.01 6.44
5162 A9 Empty 20.16 6.41
5163 A9 Empty 20.32 6.39
5164 A9 Empty 20.40 6.41
... ... ... ... ...
5800 A9 Empty 84.47 3.73
5801 A9 Empty 84.59 3.74
5802 A9 Empty 84.67 3.75
5803 A9 Empty 84.76 3.75
5804 A9 Empty 84.88 3.72
[645 rows x 4 columns], 'B1': SamplePos SampleName Temp 465-580
7740 B1 T4L wt 4 uM 20.01 5.48
7741 B1 T4L wt 4 uM 20.01 5.47
7742 B1 T4L wt 4 uM 20.16 5.46
7743 B1 T4L wt 4 uM 20.32 5.47
7744 B1 T4L wt 4 uM 20.40 5.48
... ... ... ... ...
8380 B1 T4L wt 4 uM 84.47 37.90
8381 B1 T4L wt 4 uM 84.59 37.86
8382 B1 T4L wt 4 uM 84.67 37.63
8383 B1 T4L wt 4 uM 84.76 37.48
8384 B1 T4L wt 4 uM 84.88 37.29
[645 rows x 4 columns], 'B10': SamplePos SampleName Temp 465-580
13545 B10 Empty 20.01 7.45
13546 B10 Empty 20.01 7.43
13547 B10 Empty 20.16 7.44
13548 B10 Empty 20.32 7.40
13549 B10 Empty 20.40 7.41
... ... ... ... ...
14185 B10 Empty 84.47 4.24
14186 B10 Empty 84.59 4.25
14187 B10 Empty 84.67 4.26
14188 B10 Empty 84.76 4.28
14189 B10 Empty 84.88 4.26
[645 rows x 4 columns], 'B11': SamplePos SampleName Temp 465-580
14190 B11 Empty 20.01 7.87
14191 B11 Empty 20.01 7.89
14192 B11 Empty 20.16 7.86
14193 B11 Empty 20.32 7.84
14194 B11 Empty 20.40 7.82
... ... ... ... ...
14830 B11 Empty 84.47 4.50
14831 B11 Empty 84.59 4.49
14832 B11 Empty 84.67 4.50
14833 B11 Empty 84.76 4.50
14834 B11 Empty 84.88 4.50
[645 rows x 4 columns], 'B12': SamplePos SampleName Temp 465-580
14835 B12 Empty 20.01 6.61
14836 B12 Empty 20.01 6.60
14837 B12 Empty 20.16 6.59
14838 B12 Empty 20.32 6.56
14839 B12 Empty 20.40 6.60
... ... ... ... ...
15475 B12 Empty 84.47 3.82
15476 B12 Empty 84.59 3.81
15477 B12 Empty 84.67 3.80
15478 B12 Empty 84.76 3.84
15479 B12 Empty 84.88 3.80
[645 rows x 4 columns], 'B2': SamplePos SampleName Temp 465-580
8385 B2 T4L wt 4 uM 20.01 7.09
8386 B2 T4L wt 4 uM 20.01 7.09
8387 B2 T4L wt 4 uM 20.16 7.07
8388 B2 T4L wt 4 uM 20.32 7.10
8389 B2 T4L wt 4 uM 20.40 7.09
... ... ... ... ...
9025 B2 T4L wt 4 uM 84.47 35.78
9026 B2 T4L wt 4 uM 84.59 35.55
9027 B2 T4L wt 4 uM 84.67 35.58
9028 B2 T4L wt 4 uM 84.76 35.45
9029 B2 T4L wt 4 uM 84.88 35.30
[645 rows x 4 columns], 'B3': SamplePos SampleName Temp 465-580
9030 B3 T4L wt 4 uM 20.01 7.55
9031 B3 T4L wt 4 uM 20.01 7.60
9032 B3 T4L wt 4 uM 20.16 7.61
9033 B3 T4L wt 4 uM 20.32 7.60
9034 B3 T4L wt 4 uM 20.40 7.60
... ... ... ... ...
9670 B3 T4L wt 4 uM 84.47 20.66
9671 B3 T4L wt 4 uM 84.59 20.57
9672 B3 T4L wt 4 uM 84.67 20.52
9673 B3 T4L wt 4 uM 84.76 20.52
9674 B3 T4L wt 4 uM 84.88 20.48
[645 rows x 4 columns], 'B4': SamplePos SampleName Temp 465-580
9675 B4 T4L wt 4 uM 20.01 7.04
9676 B4 T4L wt 4 uM 20.01 7.05
9677 B4 T4L wt 4 uM 20.16 7.07
9678 B4 T4L wt 4 uM 20.32 7.04
9679 B4 T4L wt 4 uM 20.40 7.08
... ... ... ... ...
10315 B4 T4L wt 4 uM 84.47 11.98
10316 B4 T4L wt 4 uM 84.59 11.97
10317 B4 T4L wt 4 uM 84.67 11.96
10318 B4 T4L wt 4 uM 84.76 11.91
10319 B4 T4L wt 4 uM 84.88 11.86
[645 rows x 4 columns], 'B5': SamplePos SampleName Temp 465-580
10320 B5 Empty 20.01 7.61
10321 B5 Empty 20.01 7.59
10322 B5 Empty 20.16 7.55
10323 B5 Empty 20.32 7.59
10324 B5 Empty 20.40 7.55
... ... ... ... ...
10960 B5 Empty 84.47 4.32
10961 B5 Empty 84.59 4.35
10962 B5 Empty 84.67 4.34
10963 B5 Empty 84.76 4.35
10964 B5 Empty 84.88 4.33
[645 rows x 4 columns], 'B6': SamplePos SampleName Temp 465-580
10965 B6 Empty 20.01 7.61
10966 B6 Empty 20.01 7.59
10967 B6 Empty 20.16 7.55
10968 B6 Empty 20.32 7.59
10969 B6 Empty 20.40 7.55
... ... ... ... ...
11605 B6 Empty 84.47 4.32
11606 B6 Empty 84.59 4.35
11607 B6 Empty 84.67 4.34
11608 B6 Empty 84.76 4.35
11609 B6 Empty 84.88 4.33
[645 rows x 4 columns], 'B7': SamplePos SampleName Temp 465-580
11610 B7 Empty 20.01 7.61
11611 B7 Empty 20.01 7.59
11612 B7 Empty 20.16 7.55
11613 B7 Empty 20.32 7.59
11614 B7 Empty 20.40 7.55
... ... ... ... ...
12250 B7 Empty 84.47 4.32
12251 B7 Empty 84.59 4.35
12252 B7 Empty 84.67 4.34
12253 B7 Empty 84.76 4.35
12254 B7 Empty 84.88 4.33
[645 rows x 4 columns], 'B8': SamplePos SampleName Temp 465-580
12255 B8 Empty 20.01 7.61
12256 B8 Empty 20.01 7.59
12257 B8 Empty 20.16 7.55
12258 B8 Empty 20.32 7.59
12259 B8 Empty 20.40 7.55
... ... ... ... ...
12895 B8 Empty 84.47 4.32
12896 B8 Empty 84.59 4.35
12897 B8 Empty 84.67 4.34
12898 B8 Empty 84.76 4.35
12899 B8 Empty 84.88 4.33
[645 rows x 4 columns], 'B9': SamplePos SampleName Temp 465-580
12900 B9 Empty 20.01 6.97
12901 B9 Empty 20.01 6.95
12902 B9 Empty 20.16 6.95
12903 B9 Empty 20.32 6.96
12904 B9 Empty 20.40 6.94
... ... ... ... ...
13540 B9 Empty 84.47 4.01
13541 B9 Empty 84.59 4.01
13542 B9 Empty 84.67 4.04
13543 B9 Empty 84.76 4.01
13544 B9 Empty 84.88 3.99
[645 rows x 4 columns], 'C1': SamplePos SampleName Temp 465-580
15480 C1 T4L wt 2 uM 20.01 4.71
15481 C1 T4L wt 2 uM 20.01 4.71
15482 C1 T4L wt 2 uM 20.16 4.70
15483 C1 T4L wt 2 uM 20.32 4.70
15484 C1 T4L wt 2 uM 20.40 4.72
... ... ... ... ...
16120 C1 T4L wt 2 uM 84.47 19.52
16121 C1 T4L wt 2 uM 84.59 19.46
16122 C1 T4L wt 2 uM 84.67 19.37
16123 C1 T4L wt 2 uM 84.76 19.31
16124 C1 T4L wt 2 uM 84.88 19.23
[645 rows x 4 columns], 'C10': SamplePos SampleName Temp 465-580
21285 C10 Empty 20.01 7.36
21286 C10 Empty 20.01 7.35
21287 C10 Empty 20.16 7.35
21288 C10 Empty 20.32 7.33
21289 C10 Empty 20.40 7.31
... ... ... ... ...
21925 C10 Empty 84.47 4.23
21926 C10 Empty 84.59 4.20
21927 C10 Empty 84.67 4.19
21928 C10 Empty 84.76 4.20
21929 C10 Empty 84.88 4.19
[645 rows x 4 columns], 'C11': SamplePos SampleName Temp 465-580
21930 C11 Empty 20.01 7.01
21931 C11 Empty 20.01 7.01
21932 C11 Empty 20.16 7.00
21933 C11 Empty 20.32 6.98
21934 C11 Empty 20.40 7.01
... ... ... ... ...
22570 C11 Empty 84.47 4.07
22571 C11 Empty 84.59 4.07
22572 C11 Empty 84.67 4.07
22573 C11 Empty 84.76 4.04
22574 C11 Empty 84.88 4.05
[645 rows x 4 columns], 'C12': SamplePos SampleName Temp 465-580
22575 C12 Empty 20.01 4.76
22576 C12 Empty 20.01 4.74
22577 C12 Empty 20.16 4.75
22578 C12 Empty 20.32 4.74
22579 C12 Empty 20.40 4.71
... ... ... ... ...
23215 C12 Empty 84.47 2.74
23216 C12 Empty 84.59 2.77
23217 C12 Empty 84.67 2.74
23218 C12 Empty 84.76 2.71
23219 C12 Empty 84.88 2.71
[645 rows x 4 columns], 'C2': SamplePos SampleName Temp 465-580
16125 C2 T4L wt 2 uM 20.01 5.72
16126 C2 T4L wt 2 uM 20.01 5.70
16127 C2 T4L wt 2 uM 20.16 5.71
16128 C2 T4L wt 2 uM 20.32 5.70
16129 C2 T4L wt 2 uM 20.40 5.72
... ... ... ... ...
16765 C2 T4L wt 2 uM 84.47 17.49
16766 C2 T4L wt 2 uM 84.59 17.48
16767 C2 T4L wt 2 uM 84.67 17.38
16768 C2 T4L wt 2 uM 84.76 17.31
16769 C2 T4L wt 2 uM 84.88 17.27
[645 rows x 4 columns], 'C3': SamplePos SampleName Temp 465-580
16770 C3 T4L wt 2 uM 20.01 6.25
16771 C3 T4L wt 2 uM 20.01 6.29
16772 C3 T4L wt 2 uM 20.16 6.32
16773 C3 T4L wt 2 uM 20.32 6.30
16774 C3 T4L wt 2 uM 20.40 6.33
... ... ... ... ...
17410 C3 T4L wt 2 uM 84.47 10.23
17411 C3 T4L wt 2 uM 84.59 10.23
17412 C3 T4L wt 2 uM 84.67 10.18
17413 C3 T4L wt 2 uM 84.76 10.17
17414 C3 T4L wt 2 uM 84.88 10.18
[645 rows x 4 columns], 'C4': SamplePos SampleName Temp 465-580
17415 C4 T4L wt 2 uM 20.01 6.07
17416 C4 T4L wt 2 uM 20.01 6.09
17417 C4 T4L wt 2 uM 20.16 6.05
17418 C4 T4L wt 2 uM 20.32 6.07
17419 C4 T4L wt 2 uM 20.40 6.09
... ... ... ... ...
18055 C4 T4L wt 2 uM 84.47 7.37
18056 C4 T4L wt 2 uM 84.59 7.36
18057 C4 T4L wt 2 uM 84.67 7.34
18058 C4 T4L wt 2 uM 84.76 7.34
18059 C4 T4L wt 2 uM 84.88 7.32
[645 rows x 4 columns], 'C5': SamplePos SampleName Temp 465-580
18060 C5 Empty 20.01 7.61
18061 C5 Empty 20.01 7.59
18062 C5 Empty 20.16 7.55
18063 C5 Empty 20.32 7.59
18064 C5 Empty 20.40 7.55
... ... ... ... ...
18700 C5 Empty 84.47 4.32
18701 C5 Empty 84.59 4.35
18702 C5 Empty 84.67 4.34
18703 C5 Empty 84.76 4.35
18704 C5 Empty 84.88 4.33
[645 rows x 4 columns], 'C6': SamplePos SampleName Temp 465-580
18705 C6 Empty 20.01 7.61
18706 C6 Empty 20.01 7.59
18707 C6 Empty 20.16 7.55
18708 C6 Empty 20.32 7.59
18709 C6 Empty 20.40 7.55
... ... ... ... ...
19345 C6 Empty 84.47 4.32
19346 C6 Empty 84.59 4.35
19347 C6 Empty 84.67 4.34
19348 C6 Empty 84.76 4.35
19349 C6 Empty 84.88 4.33
[645 rows x 4 columns], 'C7': SamplePos SampleName Temp 465-580
19350 C7 Empty 20.01 7.61
19351 C7 Empty 20.01 7.59
19352 C7 Empty 20.16 7.55
19353 C7 Empty 20.32 7.59
19354 C7 Empty 20.40 7.55
... ... ... ... ...
19990 C7 Empty 84.47 4.32
19991 C7 Empty 84.59 4.35
19992 C7 Empty 84.67 4.34
19993 C7 Empty 84.76 4.35
19994 C7 Empty 84.88 4.33
[645 rows x 4 columns], 'C8': SamplePos SampleName Temp 465-580
19995 C8 Empty 20.01 7.61
19996 C8 Empty 20.01 7.59
19997 C8 Empty 20.16 7.55
19998 C8 Empty 20.32 7.59
19999 C8 Empty 20.40 7.55
... ... ... ... ...
20635 C8 Empty 84.47 4.32
20636 C8 Empty 84.59 4.35
20637 C8 Empty 84.67 4.34
20638 C8 Empty 84.76 4.35
20639 C8 Empty 84.88 4.33
[645 rows x 4 columns], 'C9': SamplePos SampleName Temp 465-580
20640 C9 Empty 20.01 7.19
20641 C9 Empty 20.01 7.14
20642 C9 Empty 20.16 7.16
20643 C9 Empty 20.32 7.12
20644 C9 Empty 20.40 7.12
... ... ... ... ...
21280 C9 Empty 84.47 4.12
21281 C9 Empty 84.59 4.12
21282 C9 Empty 84.67 4.12
21283 C9 Empty 84.76 4.10
21284 C9 Empty 84.88 4.09
[645 rows x 4 columns], 'D1': SamplePos SampleName Temp 465-580
23220 D1 T4L wt 1 uM 20.01 4.53
23221 D1 T4L wt 1 uM 20.01 4.57
23222 D1 T4L wt 1 uM 20.16 4.55
23223 D1 T4L wt 1 uM 20.32 4.55
23224 D1 T4L wt 1 uM 20.40 4.57
... ... ... ... ...
23860 D1 T4L wt 1 uM 84.47 10.43
23861 D1 T4L wt 1 uM 84.59 10.41
23862 D1 T4L wt 1 uM 84.67 10.37
23863 D1 T4L wt 1 uM 84.76 10.32
23864 D1 T4L wt 1 uM 84.88 10.32
[645 rows x 4 columns], 'D10': SamplePos SampleName Temp 465-580
29025 D10 Empty 20.01 6.80
29026 D10 Empty 20.01 6.80
29027 D10 Empty 20.16 6.79
29028 D10 Empty 20.32 6.74
29029 D10 Empty 20.40 6.75
... ... ... ... ...
29665 D10 Empty 84.47 3.94
29666 D10 Empty 84.59 3.94
29667 D10 Empty 84.67 3.91
29668 D10 Empty 84.76 3.92
29669 D10 Empty 84.88 3.94
[645 rows x 4 columns], 'D11': SamplePos SampleName Temp 465-580
29670 D11 Empty 20.01 6.91
29671 D11 Empty 20.01 6.88
29672 D11 Empty 20.16 6.91
29673 D11 Empty 20.32 6.88
29674 D11 Empty 20.40 6.85
... ... ... ... ...
30310 D11 Empty 84.47 3.97
30311 D11 Empty 84.59 3.99
30312 D11 Empty 84.67 3.97
30313 D11 Empty 84.76 3.99
30314 D11 Empty 84.88 4.01
[645 rows x 4 columns], 'D12': SamplePos SampleName Temp 465-580
30315 D12 Empty 20.01 6.67
30316 D12 Empty 20.01 6.62
30317 D12 Empty 20.16 6.62
30318 D12 Empty 20.32 6.60
30319 D12 Empty 20.40 6.58
... ... ... ... ...
30955 D12 Empty 84.47 3.86
30956 D12 Empty 84.59 3.85
30957 D12 Empty 84.67 3.86
30958 D12 Empty 84.76 3.87
30959 D12 Empty 84.88 3.85
[645 rows x 4 columns], 'D2': SamplePos SampleName Temp 465-580
23865 D2 T4L wt 1 uM 20.01 4.97
23866 D2 T4L wt 1 uM 20.01 4.99
23867 D2 T4L wt 1 uM 20.16 4.99
23868 D2 T4L wt 1 uM 20.32 4.96
23869 D2 T4L wt 1 uM 20.40 4.98
... ... ... ... ...
24505 D2 T4L wt 1 uM 84.47 11.06
24506 D2 T4L wt 1 uM 84.59 11.03
24507 D2 T4L wt 1 uM 84.67 10.96
24508 D2 T4L wt 1 uM 84.76 10.98
24509 D2 T4L wt 1 uM 84.88 10.93
[645 rows x 4 columns], 'D3': SamplePos SampleName Temp 465-580
24510 D3 T4L wt 1 uM 20.01 5.14
24511 D3 T4L wt 1 uM 20.01 5.17
24512 D3 T4L wt 1 uM 20.16 5.22
24513 D3 T4L wt 1 uM 20.32 5.15
24514 D3 T4L wt 1 uM 20.40 5.16
... ... ... ... ...
25150 D3 T4L wt 1 uM 84.47 7.46
25151 D3 T4L wt 1 uM 84.59 7.43
25152 D3 T4L wt 1 uM 84.67 7.43
25153 D3 T4L wt 1 uM 84.76 7.42
25154 D3 T4L wt 1 uM 84.88 7.41
[645 rows x 4 columns], 'D4': SamplePos SampleName Temp 465-580
25155 D4 T4L wt 1 uM 20.01 5.53
25156 D4 T4L wt 1 uM 20.01 5.54
25157 D4 T4L wt 1 uM 20.16 5.54
25158 D4 T4L wt 1 uM 20.32 5.54
25159 D4 T4L wt 1 uM 20.40 5.53
... ... ... ... ...
25795 D4 T4L wt 1 uM 84.47 4.93
25796 D4 T4L wt 1 uM 84.59 4.93
25797 D4 T4L wt 1 uM 84.67 4.95
25798 D4 T4L wt 1 uM 84.76 4.94
25799 D4 T4L wt 1 uM 84.88 4.94
[645 rows x 4 columns], 'D5': SamplePos SampleName Temp 465-580
25800 D5 Empty 20.01 7.61
25801 D5 Empty 20.01 7.59
25802 D5 Empty 20.16 7.55
25803 D5 Empty 20.32 7.59
25804 D5 Empty 20.40 7.55
... ... ... ... ...
26440 D5 Empty 84.47 4.32
26441 D5 Empty 84.59 4.35
26442 D5 Empty 84.67 4.34
26443 D5 Empty 84.76 4.35
26444 D5 Empty 84.88 4.33
[645 rows x 4 columns], 'D6': SamplePos SampleName Temp 465-580
26445 D6 Empty 20.01 7.61
26446 D6 Empty 20.01 7.59
26447 D6 Empty 20.16 7.55
26448 D6 Empty 20.32 7.59
26449 D6 Empty 20.40 7.55
... ... ... ... ...
27085 D6 Empty 84.47 4.32
27086 D6 Empty 84.59 4.35
27087 D6 Empty 84.67 4.34
27088 D6 Empty 84.76 4.35
27089 D6 Empty 84.88 4.33
[645 rows x 4 columns], 'D7': SamplePos SampleName Temp 465-580
27090 D7 Empty 20.01 7.61
27091 D7 Empty 20.01 7.59
27092 D7 Empty 20.16 7.55
27093 D7 Empty 20.32 7.59
27094 D7 Empty 20.40 7.55
... ... ... ... ...
27730 D7 Empty 84.47 4.32
27731 D7 Empty 84.59 4.35
27732 D7 Empty 84.67 4.34
27733 D7 Empty 84.76 4.35
27734 D7 Empty 84.88 4.33
[645 rows x 4 columns], 'D8': SamplePos SampleName Temp 465-580
27735 D8 Empty 20.01 7.61
27736 D8 Empty 20.01 7.59
27737 D8 Empty 20.16 7.55
27738 D8 Empty 20.32 7.59
27739 D8 Empty 20.40 7.55
... ... ... ... ...
28375 D8 Empty 84.47 4.32
28376 D8 Empty 84.59 4.35
28377 D8 Empty 84.67 4.34
28378 D8 Empty 84.76 4.35
28379 D8 Empty 84.88 4.33
[645 rows x 4 columns], 'D9': SamplePos SampleName Temp 465-580
28380 D9 Empty 20.01 7.51
28381 D9 Empty 20.01 7.49
28382 D9 Empty 20.16 7.51
28383 D9 Empty 20.32 7.49
28384 D9 Empty 20.40 7.45
... ... ... ... ...
29020 D9 Empty 84.47 4.32
29021 D9 Empty 84.59 4.30
29022 D9 Empty 84.67 4.30
29023 D9 Empty 84.76 4.32
29024 D9 Empty 84.88 4.31
[645 rows x 4 columns], 'E1': SamplePos SampleName Temp 465-580
30960 E1 Empty 20.01 6.56
30961 E1 Empty 20.01 6.53
30962 E1 Empty 20.16 6.56
30963 E1 Empty 20.32 6.56
30964 E1 Empty 20.40 6.48
... ... ... ... ...
31600 E1 Empty 84.47 3.79
31601 E1 Empty 84.59 3.79
31602 E1 Empty 84.67 3.79
31603 E1 Empty 84.76 3.80
31604 E1 Empty 84.88 3.77
[645 rows x 4 columns], 'E10': SamplePos SampleName Temp 465-580
36765 E10 Empty 20.01 7.19
36766 E10 Empty 20.01 7.20
36767 E10 Empty 20.16 7.20
36768 E10 Empty 20.32 7.15
36769 E10 Empty 20.40 7.15
... ... ... ... ...
37405 E10 Empty 84.47 4.16
37406 E10 Empty 84.59 4.16
37407 E10 Empty 84.67 4.16
37408 E10 Empty 84.76 4.18
37409 E10 Empty 84.88 4.15
[645 rows x 4 columns], 'E11': SamplePos SampleName Temp 465-580
37410 E11 Empty 20.01 7.18
37411 E11 Empty 20.01 7.13
37412 E11 Empty 20.16 7.12
37413 E11 Empty 20.32 7.11
37414 E11 Empty 20.40 7.12
... ... ... ... ...
38050 E11 Empty 84.47 4.12
38051 E11 Empty 84.59 4.13
38052 E11 Empty 84.67 4.14
38053 E11 Empty 84.76 4.12
38054 E11 Empty 84.88 4.09
[645 rows x 4 columns], 'E12': SamplePos SampleName Temp 465-580
38055 E12 Empty 20.01 6.73
38056 E12 Empty 20.01 6.75
38057 E12 Empty 20.16 6.75
38058 E12 Empty 20.32 6.72
38059 E12 Empty 20.40 6.68
... ... ... ... ...
38695 E12 Empty 84.47 3.90
38696 E12 Empty 84.59 3.91
38697 E12 Empty 84.67 3.91
38698 E12 Empty 84.76 3.91
38699 E12 Empty 84.88 3.89
[645 rows x 4 columns], 'E2': SamplePos SampleName Temp 465-580
31605 E2 Empty 20.01 6.79
31606 E2 Empty 20.01 6.79
31607 E2 Empty 20.16 6.77
31608 E2 Empty 20.32 6.77
31609 E2 Empty 20.40 6.77
... ... ... ... ...
32245 E2 Empty 84.47 3.91
32246 E2 Empty 84.59 3.93
32247 E2 Empty 84.67 3.93
32248 E2 Empty 84.76 3.95
32249 E2 Empty 84.88 3.92
[645 rows x 4 columns], 'E3': SamplePos SampleName Temp 465-580
32250 E3 Empty 20.01 7.01
32251 E3 Empty 20.01 6.98
32252 E3 Empty 20.16 6.96
32253 E3 Empty 20.32 6.95
32254 E3 Empty 20.40 6.94
... ... ... ... ...
32890 E3 Empty 84.47 4.02
32891 E3 Empty 84.59 4.02
32892 E3 Empty 84.67 4.03
32893 E3 Empty 84.76 4.02
32894 E3 Empty 84.88 4.03
[645 rows x 4 columns], 'E4': SamplePos SampleName Temp 465-580
32895 E4 Empty 20.01 7.12
32896 E4 Empty 20.01 7.09
32897 E4 Empty 20.16 7.05
32898 E4 Empty 20.32 7.06
32899 E4 Empty 20.40 7.04
... ... ... ... ...
33535 E4 Empty 84.47 4.08
33536 E4 Empty 84.59 4.05
33537 E4 Empty 84.67 4.08
33538 E4 Empty 84.76 4.09
33539 E4 Empty 84.88 4.05
[645 rows x 4 columns], 'E5': SamplePos SampleName Temp 465-580
33540 E5 Empty 20.01 7.24
33541 E5 Empty 20.01 7.22
33542 E5 Empty 20.16 7.20
33543 E5 Empty 20.32 7.21
33544 E5 Empty 20.40 7.18
... ... ... ... ...
34180 E5 Empty 84.47 4.13
34181 E5 Empty 84.59 4.14
34182 E5 Empty 84.67 4.16
34183 E5 Empty 84.76 4.15
34184 E5 Empty 84.88 4.12
[645 rows x 4 columns], 'E6': SamplePos SampleName Temp 465-580
34185 E6 Empty 20.01 7.07
34186 E6 Empty 20.01 7.06
34187 E6 Empty 20.16 7.06
34188 E6 Empty 20.32 7.03
34189 E6 Empty 20.40 7.00
... ... ... ... ...
34825 E6 Empty 84.47 4.03
34826 E6 Empty 84.59 4.07
34827 E6 Empty 84.67 4.06
34828 E6 Empty 84.76 4.05
34829 E6 Empty 84.88 4.02
[645 rows x 4 columns], 'E7': SamplePos SampleName Temp 465-580
34830 E7 Empty 20.01 7.17
34831 E7 Empty 20.01 7.14
34832 E7 Empty 20.16 7.09
34833 E7 Empty 20.32 7.07
34834 E7 Empty 20.40 7.06
... ... ... ... ...
35470 E7 Empty 84.47 4.09
35471 E7 Empty 84.59 4.08
35472 E7 Empty 84.67 4.09
35473 E7 Empty 84.76 4.07
35474 E7 Empty 84.88 4.06
[645 rows x 4 columns], 'E8': SamplePos SampleName Temp 465-580
35475 E8 Empty 20.01 7.38
35476 E8 Empty 20.01 7.35
35477 E8 Empty 20.16 7.37
35478 E8 Empty 20.32 7.36
35479 E8 Empty 20.40 7.34
... ... ... ... ...
36115 E8 Empty 84.47 4.22
36116 E8 Empty 84.59 4.22
36117 E8 Empty 84.67 4.24
36118 E8 Empty 84.76 4.24
36119 E8 Empty 84.88 4.21
[645 rows x 4 columns], 'E9': SamplePos SampleName Temp 465-580
36120 E9 Empty 20.01 7.26
36121 E9 Empty 20.01 7.23
36122 E9 Empty 20.16 7.24
36123 E9 Empty 20.32 7.19
36124 E9 Empty 20.40 7.18
... ... ... ... ...
36760 E9 Empty 84.47 4.17
36761 E9 Empty 84.59 4.18
36762 E9 Empty 84.67 4.16
36763 E9 Empty 84.76 4.17
36764 E9 Empty 84.88 4.15
[645 rows x 4 columns], 'F1': SamplePos SampleName Temp 465-580
38700 F1 Empty 20.01 6.68
38701 F1 Empty 20.01 6.67
38702 F1 Empty 20.16 6.66
38703 F1 Empty 20.32 6.66
38704 F1 Empty 20.40 6.64
... ... ... ... ...
39340 F1 Empty 84.47 3.81
39341 F1 Empty 84.59 3.84
39342 F1 Empty 84.67 3.81
39343 F1 Empty 84.76 3.83
39344 F1 Empty 84.88 3.80
[645 rows x 4 columns], 'F10': SamplePos SampleName Temp 465-580
44505 F10 Empty 20.01 8.51
44506 F10 Empty 20.01 8.46
44507 F10 Empty 20.16 8.47
44508 F10 Empty 20.32 8.45
44509 F10 Empty 20.40 8.45
... ... ... ... ...
45145 F10 Empty 84.47 4.79
45146 F10 Empty 84.59 4.81
45147 F10 Empty 84.67 4.79
45148 F10 Empty 84.76 4.77
45149 F10 Empty 84.88 4.77
[645 rows x 4 columns], 'F11': SamplePos SampleName Temp 465-580
45150 F11 Empty 20.01 7.14
45151 F11 Empty 20.01 7.10
45152 F11 Empty 20.16 7.11
45153 F11 Empty 20.32 7.10
45154 F11 Empty 20.40 7.11
... ... ... ... ...
45790 F11 Empty 84.47 4.10
45791 F11 Empty 84.59 4.13
45792 F11 Empty 84.67 4.11
45793 F11 Empty 84.76 4.12
45794 F11 Empty 84.88 4.11
[645 rows x 4 columns], 'F12': SamplePos SampleName Temp 465-580
45795 F12 Empty 20.01 6.92
45796 F12 Empty 20.01 6.87
45797 F12 Empty 20.16 6.87
45798 F12 Empty 20.32 6.89
45799 F12 Empty 20.40 6.84
... ... ... ... ...
46435 F12 Empty 84.47 3.97
46436 F12 Empty 84.59 4.01
46437 F12 Empty 84.67 3.95
46438 F12 Empty 84.76 4.00
46439 F12 Empty 84.88 3.99
[645 rows x 4 columns], 'F2': SamplePos SampleName Temp 465-580
39345 F2 Empty 20.01 7.08
39346 F2 Empty 20.01 7.04
39347 F2 Empty 20.16 7.08
39348 F2 Empty 20.32 7.05
39349 F2 Empty 20.40 7.05
... ... ... ... ...
39985 F2 Empty 84.47 4.02
39986 F2 Empty 84.59 4.03
39987 F2 Empty 84.67 4.03
39988 F2 Empty 84.76 4.04
39989 F2 Empty 84.88 4.04
[645 rows x 4 columns], 'F3': SamplePos SampleName Temp 465-580
39990 F3 Empty 20.01 7.67
39991 F3 Empty 20.01 7.69
39992 F3 Empty 20.16 7.67
39993 F3 Empty 20.32 7.66
39994 F3 Empty 20.40 7.64
... ... ... ... ...
40630 F3 Empty 84.47 4.34
40631 F3 Empty 84.59 4.32
40632 F3 Empty 84.67 4.35
40633 F3 Empty 84.76 4.37
40634 F3 Empty 84.88 4.35
[645 rows x 4 columns], 'F4': SamplePos SampleName Temp 465-580
40635 F4 Empty 20.01 7.32
40636 F4 Empty 20.01 7.33
40637 F4 Empty 20.16 7.30
40638 F4 Empty 20.32 7.29
40639 F4 Empty 20.40 7.27
... ... ... ... ...
41275 F4 Empty 84.47 4.17
41276 F4 Empty 84.59 4.20
41277 F4 Empty 84.67 4.18
41278 F4 Empty 84.76 4.21
41279 F4 Empty 84.88 4.16
[645 rows x 4 columns], 'F5': SamplePos SampleName Temp 465-580
41280 F5 Empty 20.01 7.22
41281 F5 Empty 20.01 7.22
41282 F5 Empty 20.16 7.20
41283 F5 Empty 20.32 7.21
41284 F5 Empty 20.40 7.19
... ... ... ... ...
41920 F5 Empty 84.47 4.12
41921 F5 Empty 84.59 4.14
41922 F5 Empty 84.67 4.13
41923 F5 Empty 84.76 4.13
41924 F5 Empty 84.88 4.13
[645 rows x 4 columns], 'F6': SamplePos SampleName Temp 465-580
41925 F6 Empty 20.01 8.07
41926 F6 Empty 20.01 8.08
41927 F6 Empty 20.16 8.04
41928 F6 Empty 20.32 8.03
41929 F6 Empty 20.40 8.04
... ... ... ... ...
42565 F6 Empty 84.47 4.53
42566 F6 Empty 84.59 4.53
42567 F6 Empty 84.67 4.53
42568 F6 Empty 84.76 4.56
42569 F6 Empty 84.88 4.56
[645 rows x 4 columns], 'F7': SamplePos SampleName Temp 465-580
42570 F7 Empty 20.01 8.21
42571 F7 Empty 20.01 8.16
42572 F7 Empty 20.16 8.17
42573 F7 Empty 20.32 8.15
42574 F7 Empty 20.40 8.12
... ... ... ... ...
43210 F7 Empty 84.47 4.61
43211 F7 Empty 84.59 4.62
43212 F7 Empty 84.67 4.61
43213 F7 Empty 84.76 4.64
43214 F7 Empty 84.88 4.59
[645 rows x 4 columns], 'F8': SamplePos SampleName Temp 465-580
43215 F8 Empty 20.01 7.34
43216 F8 Empty 20.01 7.30
43217 F8 Empty 20.16 7.32
43218 F8 Empty 20.32 7.32
43219 F8 Empty 20.40 7.30
... ... ... ... ...
43855 F8 Empty 84.47 4.20
43856 F8 Empty 84.59 4.25
43857 F8 Empty 84.67 4.21
43858 F8 Empty 84.76 4.21
43859 F8 Empty 84.88 4.20
[645 rows x 4 columns], 'F9': SamplePos SampleName Temp 465-580
43860 F9 Empty 20.01 7.08
43861 F9 Empty 20.01 7.11
43862 F9 Empty 20.16 7.06
43863 F9 Empty 20.32 7.06
43864 F9 Empty 20.40 7.08
... ... ... ... ...
44500 F9 Empty 84.47 4.05
44501 F9 Empty 84.59 4.08
44502 F9 Empty 84.67 4.04
44503 F9 Empty 84.76 4.05
44504 F9 Empty 84.88 4.03
[645 rows x 4 columns], 'G1': SamplePos SampleName Temp 465-580
46440 G1 Empty 20.01 6.72
46441 G1 Empty 20.01 6.67
46442 G1 Empty 20.16 6.69
46443 G1 Empty 20.32 6.66
46444 G1 Empty 20.40 6.63
... ... ... ... ...
47080 G1 Empty 84.47 3.83
47081 G1 Empty 84.59 3.81
47082 G1 Empty 84.67 3.82
47083 G1 Empty 84.76 3.81
47084 G1 Empty 84.88 3.82
[645 rows x 4 columns], 'G10': SamplePos SampleName Temp 465-580
52245 G10 Empty 20.01 7.85
52246 G10 Empty 20.01 7.85
52247 G10 Empty 20.16 7.78
52248 G10 Empty 20.32 7.79
52249 G10 Empty 20.40 7.77
... ... ... ... ...
52885 G10 Empty 84.47 4.49
52886 G10 Empty 84.59 4.47
52887 G10 Empty 84.67 4.46
52888 G10 Empty 84.76 4.45
52889 G10 Empty 84.88 4.43
[645 rows x 4 columns], 'G11': SamplePos SampleName Temp 465-580
52890 G11 Empty 20.01 7.99
52891 G11 Empty 20.01 7.98
52892 G11 Empty 20.16 7.95
52893 G11 Empty 20.32 7.97
52894 G11 Empty 20.40 7.98
... ... ... ... ...
53530 G11 Empty 84.47 4.61
53531 G11 Empty 84.59 4.59
53532 G11 Empty 84.67 4.59
53533 G11 Empty 84.76 4.60
53534 G11 Empty 84.88 4.57
[645 rows x 4 columns], 'G12': SamplePos SampleName Temp 465-580
53535 G12 Empty 20.01 6.92
53536 G12 Empty 20.01 6.92
53537 G12 Empty 20.16 6.86
53538 G12 Empty 20.32 6.87
53539 G12 Empty 20.40 6.85
... ... ... ... ...
54175 G12 Empty 84.47 4.04
54176 G12 Empty 84.59 4.02
54177 G12 Empty 84.67 4.00
54178 G12 Empty 84.76 4.00
54179 G12 Empty 84.88 4.01
[645 rows x 4 columns], 'G2': SamplePos SampleName Temp 465-580
47085 G2 Empty 20.01 7.21
47086 G2 Empty 20.01 7.17
47087 G2 Empty 20.16 7.17
47088 G2 Empty 20.32 7.14
47089 G2 Empty 20.40 7.14
... ... ... ... ...
47725 G2 Empty 84.47 4.07
47726 G2 Empty 84.59 4.10
47727 G2 Empty 84.67 4.12
47728 G2 Empty 84.76 4.10
47729 G2 Empty 84.88 4.09
[645 rows x 4 columns], 'G3': SamplePos SampleName Temp 465-580
47730 G3 Empty 20.01 7.34
47731 G3 Empty 20.01 7.32
47732 G3 Empty 20.16 7.31
47733 G3 Empty 20.32 7.29
47734 G3 Empty 20.40 7.28
... ... ... ... ...
48370 G3 Empty 84.47 4.19
48371 G3 Empty 84.59 4.18
48372 G3 Empty 84.67 4.18
48373 G3 Empty 84.76 4.17
48374 G3 Empty 84.88 4.19
[645 rows x 4 columns], 'G4': SamplePos SampleName Temp 465-580
48375 G4 Empty 20.01 6.96
48376 G4 Empty 20.01 6.97
48377 G4 Empty 20.16 6.99
48378 G4 Empty 20.32 6.98
48379 G4 Empty 20.40 6.92
... ... ... ... ...
49015 G4 Empty 84.47 3.98
49016 G4 Empty 84.59 3.99
49017 G4 Empty 84.67 3.99
49018 G4 Empty 84.76 3.99
49019 G4 Empty 84.88 3.99
[645 rows x 4 columns], 'G5': SamplePos SampleName Temp 465-580
49020 G5 Empty 20.01 7.50
49021 G5 Empty 20.01 7.47
49022 G5 Empty 20.16 7.49
49023 G5 Empty 20.32 7.49
49024 G5 Empty 20.40 7.47
... ... ... ... ...
49660 G5 Empty 84.47 4.31
49661 G5 Empty 84.59 4.32
49662 G5 Empty 84.67 4.31
49663 G5 Empty 84.76 4.29
49664 G5 Empty 84.88 4.31
[645 rows x 4 columns], 'G6': SamplePos SampleName Temp 465-580
49665 G6 Empty 20.01 7.44
49666 G6 Empty 20.01 7.45
49667 G6 Empty 20.16 7.44
49668 G6 Empty 20.32 7.42
49669 G6 Empty 20.40 7.41
... ... ... ... ...
50305 G6 Empty 84.47 4.27
50306 G6 Empty 84.59 4.28
50307 G6 Empty 84.67 4.27
50308 G6 Empty 84.76 4.26
50309 G6 Empty 84.88 4.28
[645 rows x 4 columns], 'G7': SamplePos SampleName Temp 465-580
50310 G7 Empty 20.01 7.65
50311 G7 Empty 20.01 7.64
50312 G7 Empty 20.16 7.63
50313 G7 Empty 20.32 7.61
50314 G7 Empty 20.40 7.59
... ... ... ... ...
50950 G7 Empty 84.47 4.35
50951 G7 Empty 84.59 4.37
50952 G7 Empty 84.67 4.36
50953 G7 Empty 84.76 4.34
50954 G7 Empty 84.88 4.36
[645 rows x 4 columns], 'G8': SamplePos SampleName Temp 465-580
50955 G8 Empty 20.01 7.64
50956 G8 Empty 20.01 7.62
50957 G8 Empty 20.16 7.61
50958 G8 Empty 20.32 7.61
50959 G8 Empty 20.40 7.60
... ... ... ... ...
51595 G8 Empty 84.47 4.39
51596 G8 Empty 84.59 4.40
51597 G8 Empty 84.67 4.39
51598 G8 Empty 84.76 4.38
51599 G8 Empty 84.88 4.36
[645 rows x 4 columns], 'G9': SamplePos SampleName Temp 465-580
51600 G9 Empty 20.01 7.41
51601 G9 Empty 20.01 7.43
51602 G9 Empty 20.16 7.41
51603 G9 Empty 20.32 7.37
51604 G9 Empty 20.40 7.38
... ... ... ... ...
52240 G9 Empty 84.47 4.27
52241 G9 Empty 84.59 4.25
52242 G9 Empty 84.67 4.26
52243 G9 Empty 84.76 4.23
52244 G9 Empty 84.88 4.25
[645 rows x 4 columns], 'H1': SamplePos SampleName Temp 465-580
54180 H1 Empty 20.01 7.14
54181 H1 Empty 20.01 7.08
54182 H1 Empty 20.16 7.06
54183 H1 Empty 20.32 7.03
54184 H1 Empty 20.40 7.07
... ... ... ... ...
54820 H1 Empty 84.47 4.04
54821 H1 Empty 84.59 4.03
54822 H1 Empty 84.67 4.07
54823 H1 Empty 84.76 4.02
54824 H1 Empty 84.88 4.04
[645 rows x 4 columns], 'H10': SamplePos SampleName Temp 465-580
59985 H10 Empty 20.01 7.59
59986 H10 Empty 20.01 7.62
59987 H10 Empty 20.16 7.56
59988 H10 Empty 20.32 7.52
59989 H10 Empty 20.40 7.58
... ... ... ... ...
60625 H10 Empty 84.47 4.36
60626 H10 Empty 84.59 4.40
60627 H10 Empty 84.67 4.37
60628 H10 Empty 84.76 4.37
60629 H10 Empty 84.88 4.36
[645 rows x 4 columns], 'H11': SamplePos SampleName Temp 465-580
60630 H11 Empty 20.01 7.46
60631 H11 Empty 20.01 7.45
60632 H11 Empty 20.16 7.39
60633 H11 Empty 20.32 7.39
60634 H11 Empty 20.40 7.39
... ... ... ... ...
61270 H11 Empty 84.47 4.29
61271 H11 Empty 84.59 4.33
61272 H11 Empty 84.67 4.29
61273 H11 Empty 84.76 4.29
61274 H11 Empty 84.88 4.28
[645 rows x 4 columns], 'H12': SamplePos SampleName Temp 465-580
61275 H12 Empty 20.01 7.61
61276 H12 Empty 20.01 7.59
61277 H12 Empty 20.16 7.55
61278 H12 Empty 20.32 7.59
61279 H12 Empty 20.40 7.55
... ... ... ... ...
61915 H12 Empty 84.47 4.32
61916 H12 Empty 84.59 4.35
61917 H12 Empty 84.67 4.34
61918 H12 Empty 84.76 4.35
61919 H12 Empty 84.88 4.33
[645 rows x 4 columns], 'H2': SamplePos SampleName Temp 465-580
54825 H2 Empty 20.01 7.01
54826 H2 Empty 20.01 7.02
54827 H2 Empty 20.16 6.97
54828 H2 Empty 20.32 6.97
54829 H2 Empty 20.40 6.96
... ... ... ... ...
55465 H2 Empty 84.47 4.01
55466 H2 Empty 84.59 4.01
55467 H2 Empty 84.67 4.02
55468 H2 Empty 84.76 3.99
55469 H2 Empty 84.88 3.99
[645 rows x 4 columns], 'H3': SamplePos SampleName Temp 465-580
55470 H3 Empty 20.01 7.24
55471 H3 Empty 20.01 7.25
55472 H3 Empty 20.16 7.22
55473 H3 Empty 20.32 7.20
55474 H3 Empty 20.40 7.18
... ... ... ... ...
56110 H3 Empty 84.47 4.12
56111 H3 Empty 84.59 4.12
56112 H3 Empty 84.67 4.12
56113 H3 Empty 84.76 4.12
56114 H3 Empty 84.88 4.11
[645 rows x 4 columns], 'H4': SamplePos SampleName Temp 465-580
56115 H4 Empty 20.01 7.27
56116 H4 Empty 20.01 7.25
56117 H4 Empty 20.16 7.20
56118 H4 Empty 20.32 7.23
56119 H4 Empty 20.40 7.24
... ... ... ... ...
56755 H4 Empty 84.47 4.14
56756 H4 Empty 84.59 4.17
56757 H4 Empty 84.67 4.11
56758 H4 Empty 84.76 4.12
56759 H4 Empty 84.88 4.12
[645 rows x 4 columns], 'H5': SamplePos SampleName Temp 465-580
56760 H5 Empty 20.01 6.72
56761 H5 Empty 20.01 6.72
56762 H5 Empty 20.16 6.69
56763 H5 Empty 20.32 6.70
56764 H5 Empty 20.40 6.69
... ... ... ... ...
57400 H5 Empty 84.47 3.83
57401 H5 Empty 84.59 3.83
57402 H5 Empty 84.67 3.84
57403 H5 Empty 84.76 3.84
57404 H5 Empty 84.88 3.82
[645 rows x 4 columns], 'H6': SamplePos SampleName Temp 465-580
57405 H6 Empty 20.01 6.96
57406 H6 Empty 20.01 6.98
57407 H6 Empty 20.16 6.94
57408 H6 Empty 20.32 6.93
57409 H6 Empty 20.40 6.90
... ... ... ... ...
58045 H6 Empty 84.47 3.97
58046 H6 Empty 84.59 4.00
58047 H6 Empty 84.67 3.95
58048 H6 Empty 84.76 3.99
58049 H6 Empty 84.88 3.95
[645 rows x 4 columns], 'H7': SamplePos SampleName Temp 465-580
58050 H7 Empty 20.01 7.49
58051 H7 Empty 20.01 7.45
58052 H7 Empty 20.16 7.40
58053 H7 Empty 20.32 7.41
58054 H7 Empty 20.40 7.40
... ... ... ... ...
58690 H7 Empty 84.47 4.24
58691 H7 Empty 84.59 4.27
58692 H7 Empty 84.67 4.24
58693 H7 Empty 84.76 4.22
58694 H7 Empty 84.88 4.23
[645 rows x 4 columns], 'H8': SamplePos SampleName Temp 465-580
58695 H8 Empty 20.01 6.75
58696 H8 Empty 20.01 6.75
58697 H8 Empty 20.16 6.74
58698 H8 Empty 20.32 6.68
58699 H8 Empty 20.40 6.73
... ... ... ... ...
59335 H8 Empty 84.47 3.90
59336 H8 Empty 84.59 3.89
59337 H8 Empty 84.67 3.90
59338 H8 Empty 84.76 3.89
59339 H8 Empty 84.88 3.89
[645 rows x 4 columns], 'H9': SamplePos SampleName Temp 465-580
59340 H9 Empty 20.01 7.15
59341 H9 Empty 20.01 7.13
59342 H9 Empty 20.16 7.12
59343 H9 Empty 20.32 7.12
59344 H9 Empty 20.40 7.08
... ... ... ... ...
59980 H9 Empty 84.47 4.11
59981 H9 Empty 84.59 4.13
59982 H9 Empty 84.67 4.10
59983 H9 Empty 84.76 4.08
59984 H9 Empty 84.88 4.14
[645 rows x 4 columns]}
We now plot the raw data for each well of the plate. We use the matplotlib.gridspec.GridSpec function to make a grid of plots. This takes a while.
WellsAll96=['A1','A2','A3','A4','A5','A6','A7','A8','A9','A10','A11','A12','B1','B2','B3','B4','B5','B6','B7','B8','B9','B10','B11','B12','C1','C2','C3','C4','C5','C6','C7','C8','C9','C10','C11','C12','D1','D2','D3','D4','D5','D6','D7','D8','D9','D10','D11','D12','E1','E2','E3','E4','E5','E6','E7','E8','E9','E10','E11','E12','F1','F2','F3','F4','F5','F6','F7','F8','F9','F10','F11','F12','G1','G2','G3','G4','G5','G6','G7','G8','G9','G10','G11','G12','H1','H2','H3','H4','H5','H6','H7','H8','H9','H10','H11','H12']

fig = plt.figure(figsize=(14,10), constrained_layout=True)
# We create a figure object. If we don't use constrained_layout, then labels overlap the axes.

gs1 = fig.add_gridspec(8, 12)
# We use gridspec to create grid-shaped combinations of graphs. P.S. an alternative is to use subplots.
# The number of rows (in our case 8) and number of columns (in our case 12) of the grid need to be set.

axs = []

for i, num in zip(WellsAll96, range(1,97)):
    axs.append(fig.add_subplot(gs1[num - 1]))
    axs[-1].plot(dict_of_wells[i]['Temp'] + 273.15, dict_of_wells[i]['465-580'])
    axs[-1].set_title(i)
    # We loop over all wells i using for. We have 96 wells, hence range(1,97).
    # We append each plot to the grid previously created. The title of each plot is the name of the well, e.g. A1, A2.

plt.show()
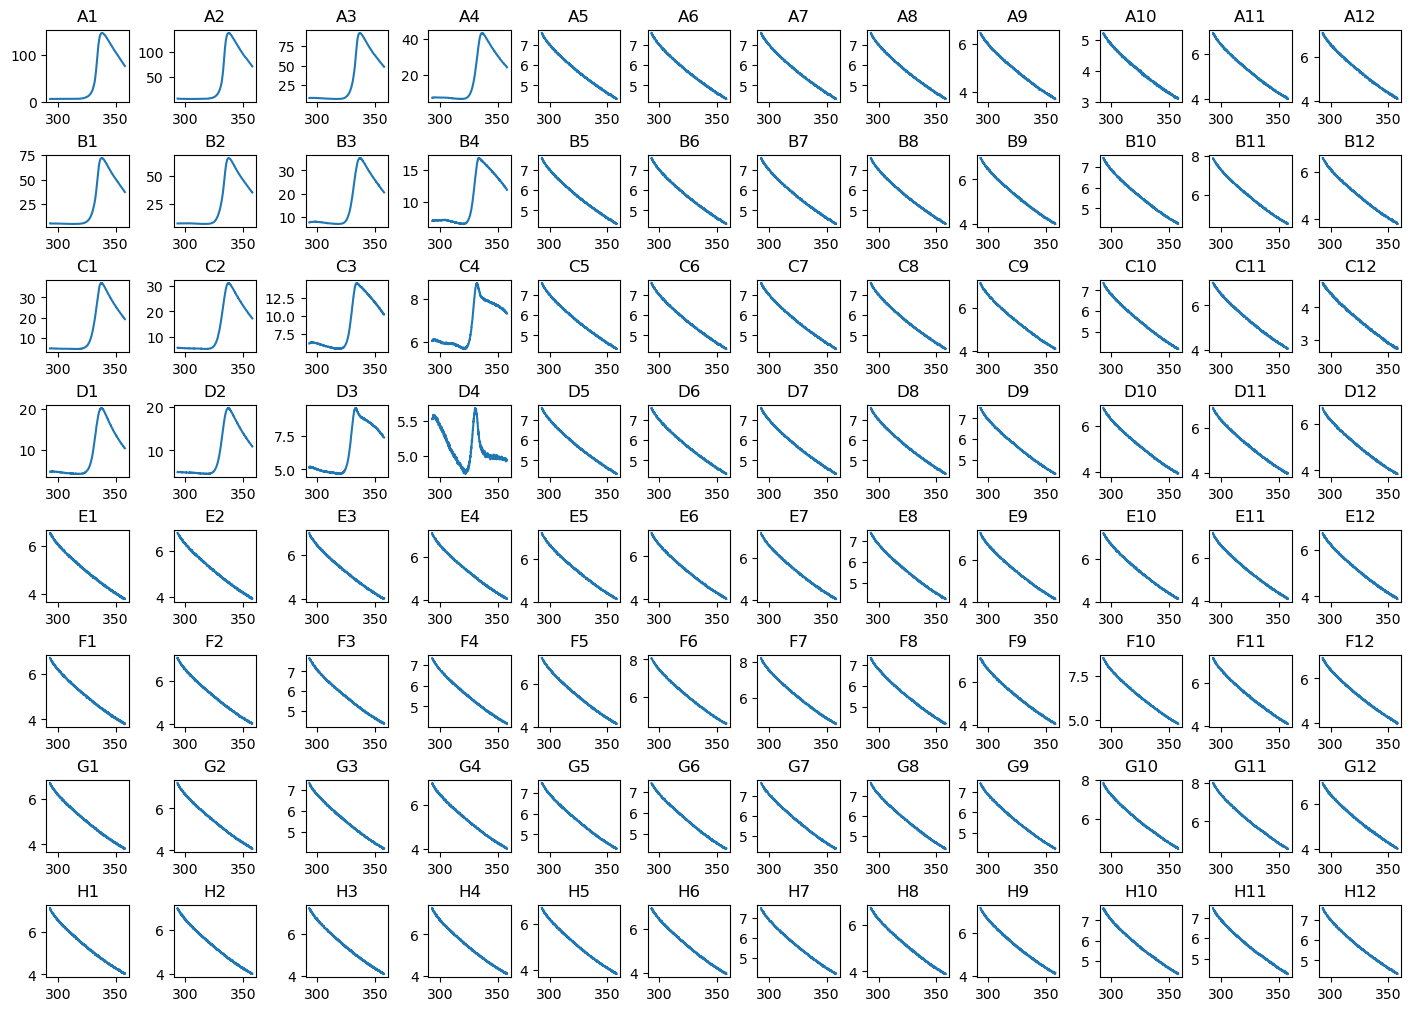
Let’s now fit all data corresponding to T4 Lysozyme WT* (i.e. A1 to D4, the other wells are empty) using the equation describing the unfolding of a monomer via a two-state mechanism but with temperature-independent enthalpy and entropy. We do first create an empty DataFrame with only column names, we will store the fitted melting temperatures in this DataFrame. We use the pandas.concat function in the loop to add rows to it.
dfObj = pd.DataFrame(columns=['SamplePos', 'Tm', 'Error'])

fig = plt.figure(figsize=(14,10), constrained_layout=True)
gs1 = fig.add_gridspec(4, 4)
axs = []

for i, num in zip(['A1','A2','A3','A4','B1','B2','B3','B4','C1','C2','C3','C4','D1','D2','D3','D4'], range(1,17)):

    x=dict_of_wells[i]['Temp'] + 273.15 # convert from °C to °K
    y=dict_of_wells[i]['465-580']

    params, params_covariance = curve_fit(funcUFnoDCp, x, y,[6, -0.01, 150, 0.02, 402000, 330], maxfev=10000) # initial guess for curve_fit - this might not be a good estimate for each condition!

    dfAdd = pd.DataFrame({'SamplePos': [i], 'Tm': [params[5]], 'Error': [np.sqrt(np.diag(params_covariance))[5]]})

    dfObj = pd.concat((dfObj, dfAdd), axis = 0)

    axs.append(fig.add_subplot(gs1[num - 1]))
    axs[-1].plot(dict_of_wells[i]['Temp'] + 273.15, dict_of_wells[i]['465-580'])
    axs[-1].plot(x, funcUFnoDCp(x, *params), color="red",label='Fit')
    axs[-1].set_title(i)

plt.show()
print(dfObj)
C:\Users\ucbtrv2\AppData\Local\Temp\ipykernel_18504\1461521699.py:16: FutureWarning: The behavior of DataFrame concatenation with empty or all-NA entries is deprecated. In a future version, this will no longer exclude empty or all-NA columns when determining the result dtypes. To retain the old behavior, exclude the relevant entries before the concat operation.
  dfObj = pd.concat((dfObj, dfAdd), axis = 0)
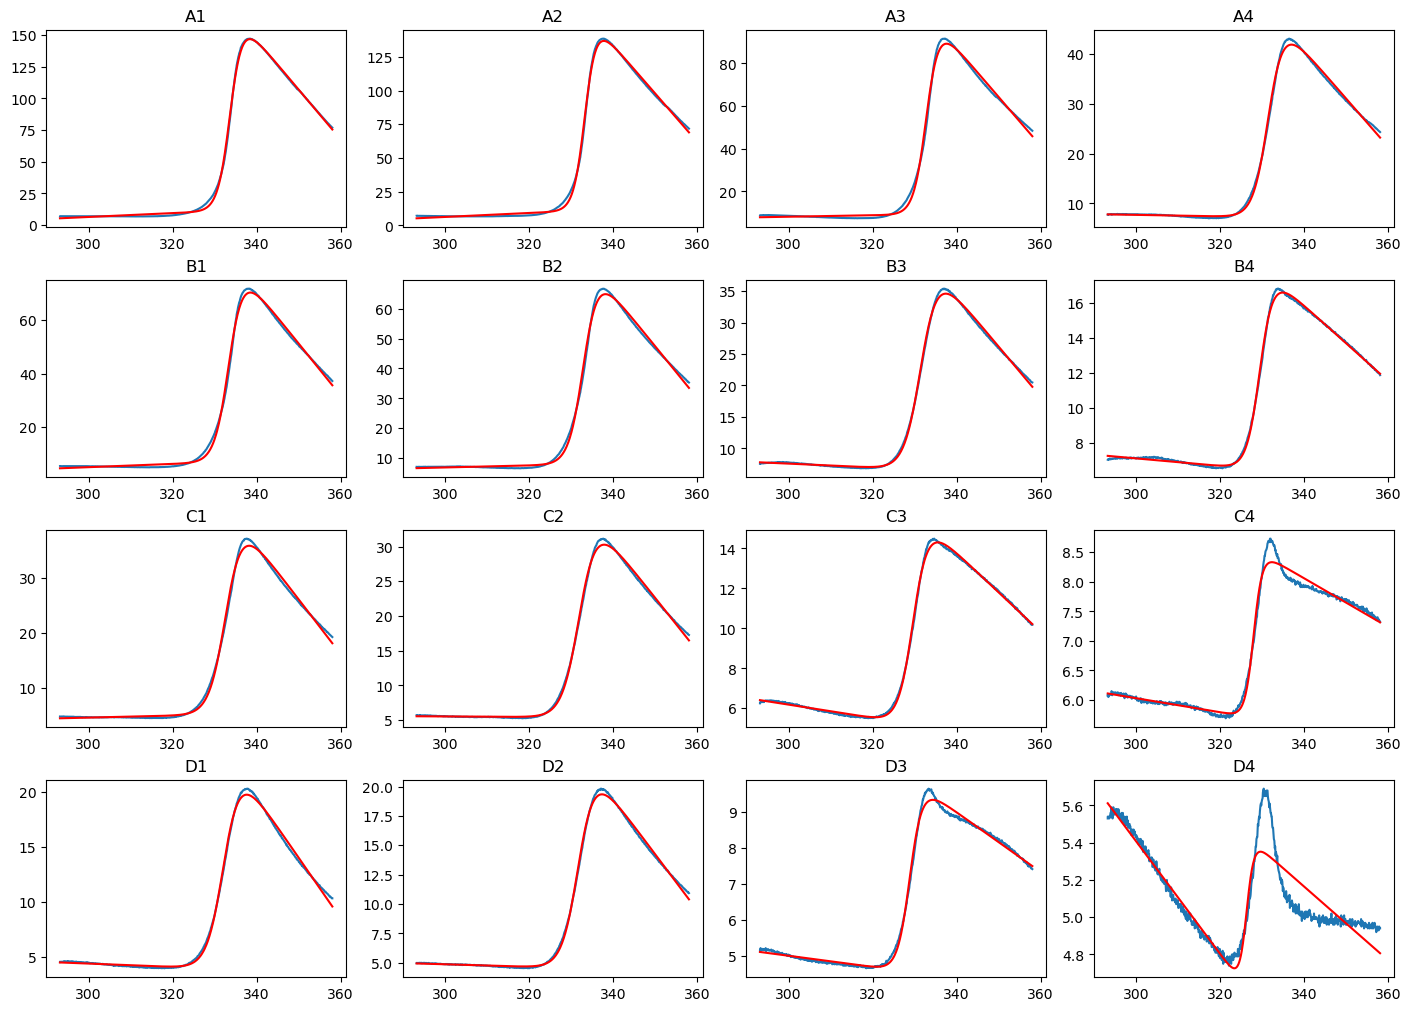
  SamplePos          Tm     Error
0        A1  333.812832  0.012452
0        A2  333.365094  0.014226
0        A3  332.896370  0.021205
0        A4  331.564137  0.018647
0        B1  333.540712  0.021271
0        B2  333.053548  0.022692
0        B3  331.686003  0.015675
0        B4  329.483934  0.013724
0        C1  332.858759  0.024700
0        C2  332.166180  0.018651
0        C3  329.744508  0.014210
0        C4  327.951536  0.032072
0        D1  332.359852  0.021023
0        D2  331.910076  0.017261
0        D3  328.908492  0.023433
0        D4  326.209046  0.099373
We can see that wells C4, D3, and D4 - those wells with low amounts of protein and high amount of dye - do not give the expected, characteristic signal and, consequently, cannot be fitted nicely.
We can see that wells A4, B3, B4, C1, C2, C3, D1, and D2 do give the expected characteristic signal, but the overall fluorescence change is small (from 0 to <50).
We can conclude that the experimental conditions in wells A1, A2, A3, B1, and B2 are suitable. However, based on the overall fluorescence change, I am more inclined to choose the conditions of A1.
