Pandas For Working With Tabular Data#
Pandas is a library designed to work with tabular data. It is built on NumPy. Data in pandas is often used to plot with Matplotlib or feed statistical analysis with Seaborn. Its ease of use makes it ideal to work with large data sets.
DataFrames have a size and shape#
Pandas Series are a one-dimensional labeled array holding data of any type.
Pandas DataFrames are structures that contain data organized in two dimensions, i.e. rows and columns. Both rows and columns have indices. Columns can have labels too.
DataFrames have a variety of properties:
size: the total number of elements
shape: the number of units along each dimension
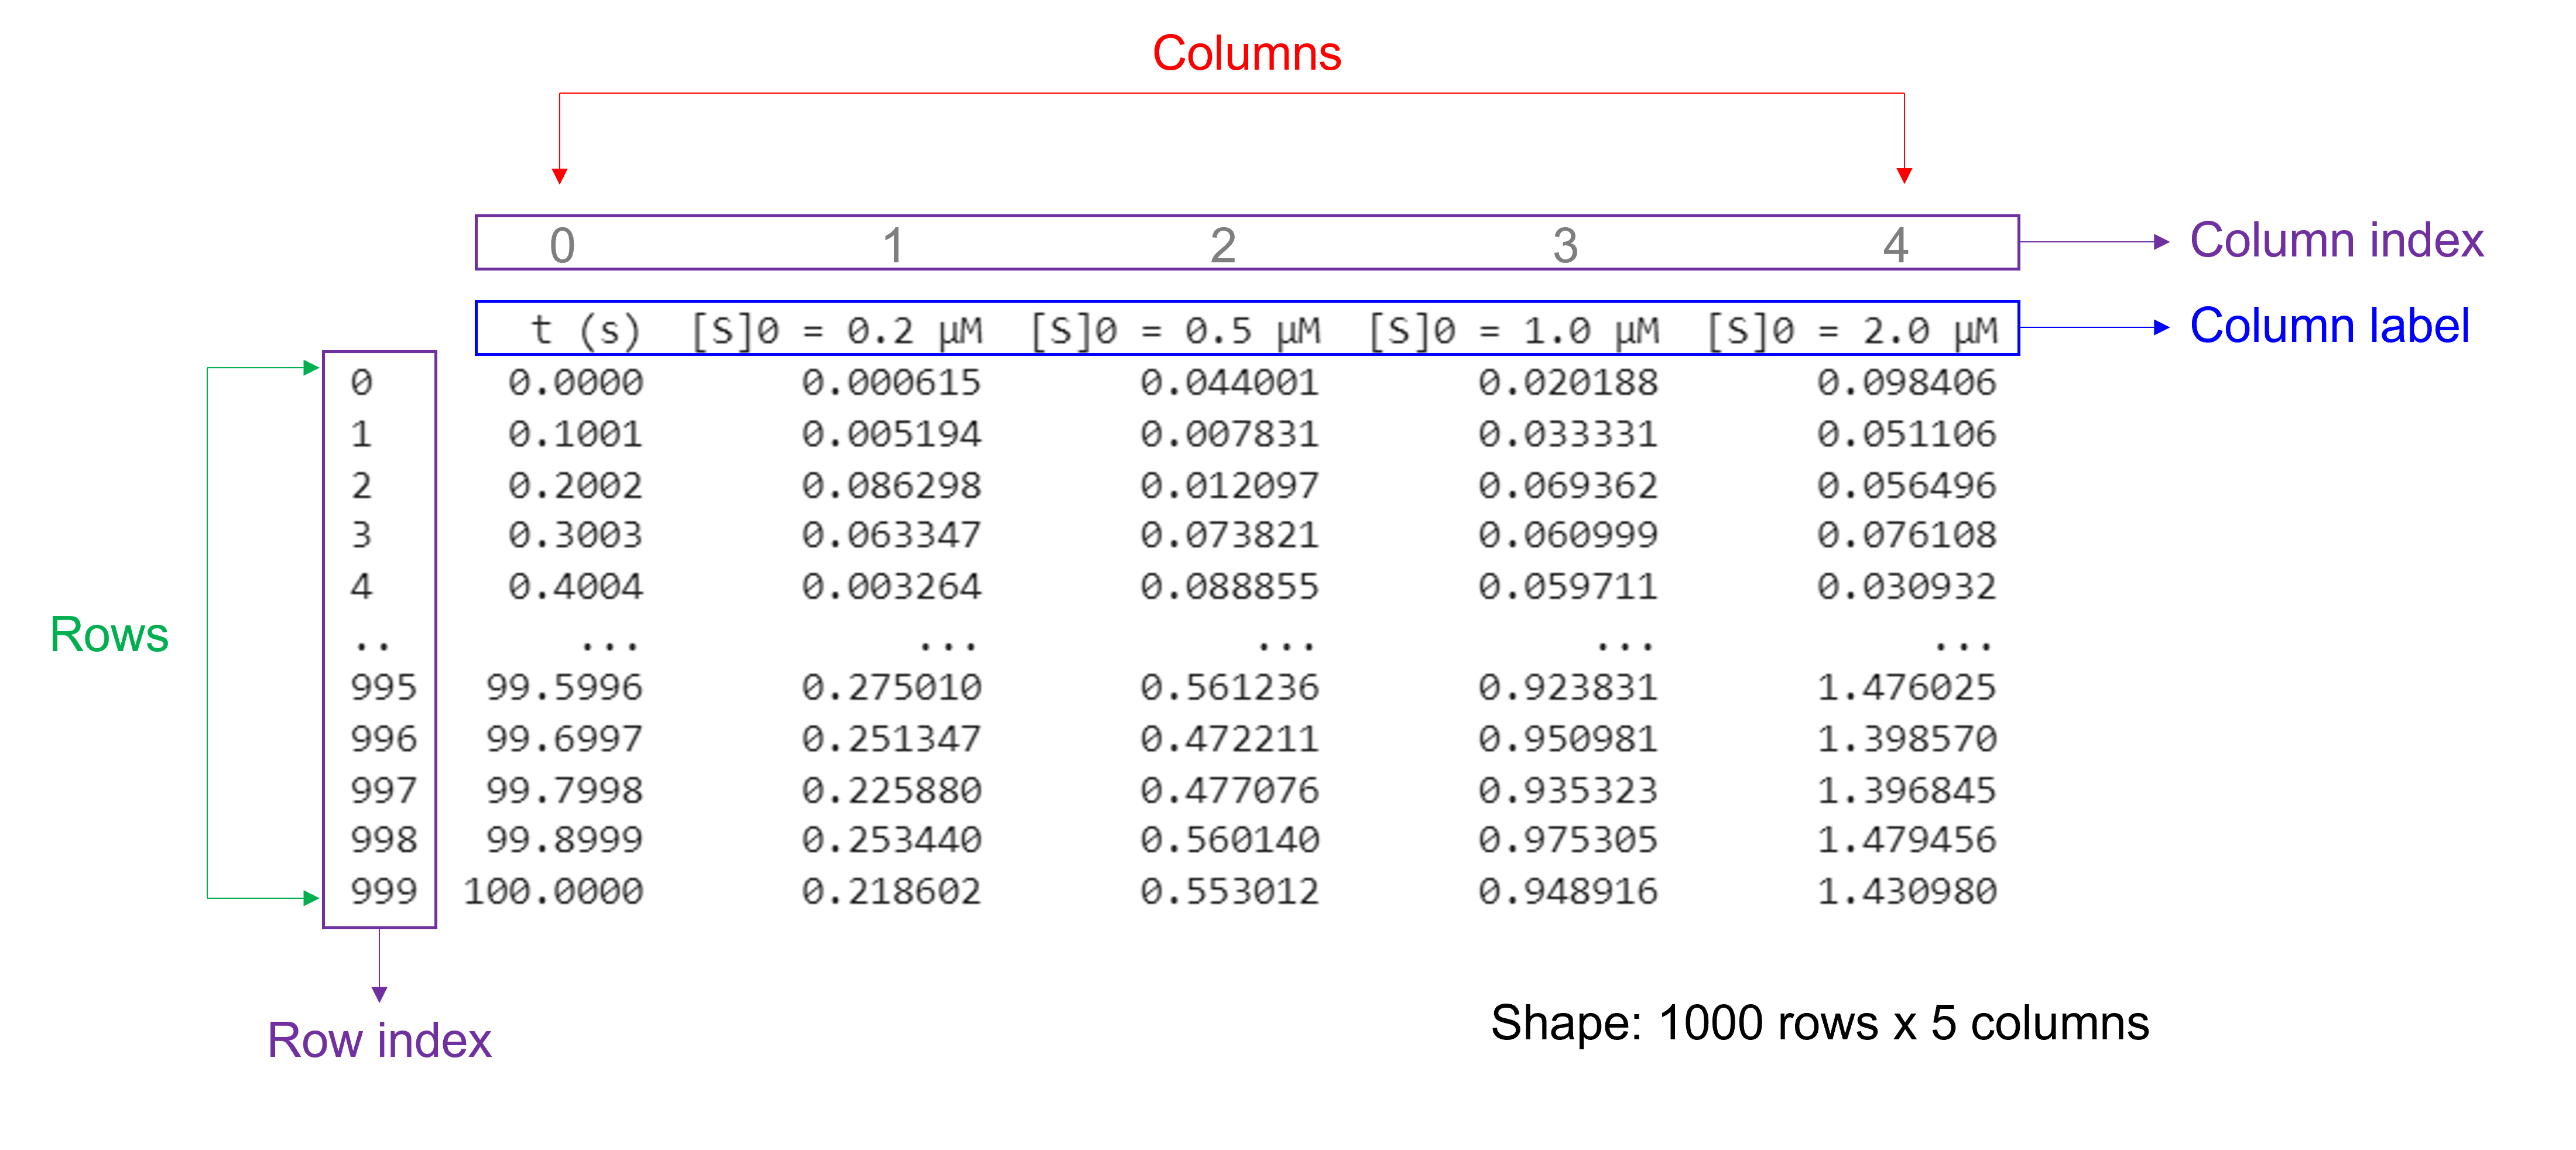
Of note, NumPy arrays and pandas Series have one data type for the entire array or Series while pandas DataFrames have one data type per column. Missing data is shown as NaN.
Creating a DataFrame from an Excel file#
We can read in data from an Excel file into Python using pandas with pd.read_excel(file_name). Do not forget to include the file path (not needed if the file is saved in the directory from which we are running the script!) and extension.
This function has several arguments. Here, we list commonly used ones:
To read in data from a specific sheet, use the argument
sheet_name. Sheet numbers start with zero! By default, this is set to0and the first sheet is used.To skip rows at the beginning and end when reading an Excel sheet, use the arguments
skiprowsandskipfooter. By default, both are set to0and no rows at the beginning and end are skipped.To only read certain columns when importing an Excel sheet, use the argument
usecols. Column numbers start with zero! By default, this is setNoneand all columns are parsed.To specify a specific row as column labels, use the argument
header. By default, this is set to0and the first row of the Excel file (with index 0) is used as column labels.To label columns when importing an Excel sheet without column names, use the arguments
header=Noneandnames=['column_name 1', ... ,'column_name_n']. To relabel columns when importing an Excel sheet that already contains column names in the first row, use the argumentsheader=None,skiprows=1, andnames=['column_name_1', ... ,'column_name_n'].
Indexing and slicing for DataFrames#
We can select rows, columns, and positions in a DataFrame using dataframe_name.iloc[]. There are two arguments: a row selector, and an optional column selector: dataframe_name.iloc[row_index, column_index]. Both accept the zero-based indices of rows and columns.
To select an entire row, simply specify the index of the row, e.g. dataframe_name.iloc[0] to access row 0.
To select an entire column, specify the index of the column and provide : for the row index, e.g. dataframe_name.iloc[:,0] to access column 0. Instead of using the .iloc method to extract a column, we can also use square brackets with the column name of interest. For example, both dataframe_name.iloc[:,0] and dataframe_name['column_name_1'] give the first column of the DataFrame.
We can also use a range for the row index and/or column index to slice multiple elements using: dataframe_name.iloc[start_index_row:end_index_row, start_index_column:end_index_column]. We select data from position start_index (included) to position end_index (excluded).
Example#
Please pay attention to the use of comments (with #) to express the units of variables or to describe the meaning of commands.
Example
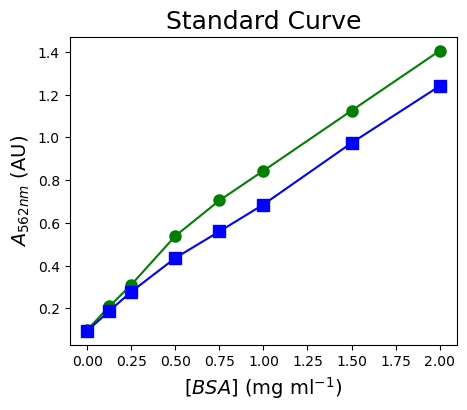
You measured the BSA standards for a colorimetric assay in duplicate. You collected your data in an Excel file called “StandardCurve.xlsx”. Read in this data file with pandas and plot the data with matplotlib.
Download the Excel file here.
#import the library needed (i.e. pandas) and introduce convenient naming
import pandas as pd

dfStandardCurve = pd.read_excel ('../data/StandardCurve.xlsx',   #create a pandas DataFrame from the filename with file path and extension shown
                    sheet_name=0,   #use the first sheet (no need to specifically include this as we use the default setting)
                    skiprows=0,   #skip no rows (no need to specifically include this as we use the default setting)
                    usecols=None,   #import all columns (no need to specifically include this as we use the default setting)
                    header=0,   #use the column names from the now first row as column labels (no need to specifically include this as we use the default setting)
                    skipfooter=0)   #skip no footers (no need to specifically include this as we use the default setting)

print(dfStandardCurve)   #print the DataFrame created
   [BSA] (mg/ml)  A562nm (AU) - 1  A562nm (AU) - 2
0          2.000            1.405            1.240
1          1.500            1.125            0.974
2          1.000            0.844            0.686
3          0.750            0.705            0.560
4          0.500            0.539            0.436
5          0.250            0.311            0.278
6          0.125            0.209            0.188
7          0.000            0.100            0.095
#import the library needed (i.e. pandas) and introduce convenient naming
import matplotlib.pyplot as plt

#Plot the data
plt.figure(figsize=(5,4))   #start a figure object

plt.plot(dfStandardCurve['[BSA] (mg/ml)'], dfStandardCurve['A562nm (AU) - 1'],   #plot a set of x (= the BSA concentrations) ,y (=the measured absorbances) data
         marker='o', color='green', markersize=8)   #use a round, green marker with size 8

plt.plot(dfStandardCurve['[BSA] (mg/ml)'], dfStandardCurve['A562nm (AU) - 2'],   #plot a set of x (= the same BSA concentrations) ,y (=the measured absorbances) data, a duplicate experiment
         marker='s', color='blue', markersize=8)   #use a square, blue marker with size 8

plt.title('Standard Curve', fontsize=18)   #define the graph title
plt.xlabel('$[BSA]$ (mg ml$^{-1}$)', fontsize=14)   #define the X-axis label
plt.ylabel('$A_{562nm}$ (AU)', fontsize=14)   #define the Y-axis label

plt.show()   #show the figure object
Exercise#
Exercise
You measured absorbance versus time for an enzyme reaction. You collected your data in an Excel file called “EnzymeKinetics.xlsx”. Read in this data file with pandas and plot the data with matplotlib.
Download the Excel file here.
Solution
Here’s one possible solution.
#import the library needed (i.e. pandas) and introduce convenient naming
import pandas as pd

dfEnzymeKinetics = pd.read_excel ('../data/EnzymeKinetics.xlsx',   #create a pandas DataFrame from the filename with file path and extension shown
                    sheet_name=0,   #use the first sheet (no need to specifically include this as we use the default setting)
                    skiprows=0,   #skip no rows (no need to specifically include this as we use the default setting)
                    usecols=None,   #import all columns (no need to specifically include this as we use the default setting)
                    header=0,   #use the column names from the now first row as column labels (no need to specifically include this as we use the default setting)
                    skipfooter=0)   #skip no footers (no need to specifically include this as we use the default setting)

print(dfEnzymeKinetics)   #print the DataFrame created
#import the library needed (i.e. pandas) and introduce convenient naming
import matplotlib.pyplot as plt

#Plot the data
plt.figure(figsize=(5,4))   #start a figure object

plt.plot(dfEnzymeKinetics['Time (s)'], dfEnzymeKinetics['A450nm (AU)'],   #plot a set of x (= time points) ,y (=the measured absorbances) data
         marker='o', color='black', markersize=8)   #use a round, black marker with size 8

plt.title('Progress curve', fontsize=18)   #define the graph title
plt.xlabel('$Time$ (s)', fontsize=14)   #define the X-axis label
plt.ylabel('$A_{450nm}$ (AU)', fontsize=14)   #define the Y-axis label

plt.show()   #show the figure object