The generalized (Extreme Studentized Deviate) ESD test#
Purpose#
The generalized ESD test detects one or more outliers in a dataset that is assumed to be normally distributed.
You must specify the maximum number of outliers, r, to test for.
How it works#
The generalized ESD test essentially performs r separate tests: a test for one outlier, a test for two outliers, and so on until r outliers.
First, a null hypothesis (\(H_{0}\)) is defined. In this case, H₀ assumes that there are no outliers in the dataset. The alternative hypothesis (\(H_{a}\)) is that there are up to r outliers in the dataset.
Next, for each step, we calculate the generalized ESD test statistic, \(R_{i}\)
with \(\overline{x}\) and s denoting the sample mean and standard deviation, respectively.
Remove the observation that maximizes \(|x_{i}-\overline{x}|\) and then recompute the above statistic with n - 1 observations.
Repeat this process until r observations have been removed. This results in the r test statistics \(R_{1}\), \(R_{2}\), …, \(R_{r}\).
At the same time, compute the following corresponding critical values
where \(t_{p,\nu}\) is the critical value from the t distribution with \(\nu\) degrees of freedom and
The number of outliers is determined by finding the largest i such that \(R_{i}\) > \(\lambda_{i}\).
Example#
# Import the libraries needed

import matplotlib.pyplot as plt   # For creating visualizations and plots
import numpy as np                # For numerical computations and handling arrays
import scipy.stats as stats       # For statistical functions and probability distributions
import pandas as pd               # For working with dataframes
# Define an example dataset

# Create a 1D NumPy array with some sample values (our dataset)
y = np.array([145, 125, 190, 135, 220, 130, 210, 3, 165, 165, 150, 350, 170, 180, 195, 440, 215, 135, 410, 40, 140, 175])

# Create an array with evenly spaced numbers within a given interval (0, 1, 2, ...) to use as the x-axis
# Use np.arange(start (optional, default = 0), stop = len(y), step (optional, default = 1))
x = np.arange(len(y))
# Visualize the dataset

# Create a scatter plot of the data using x = indices (0, 1, 2, ...) and y = dataset values
plt.scatter(x,y)

# Add labels to the x-axis and y-axis
plt.xlabel("Index (x)")         # Describes what x-values represent
plt.ylabel("Data values (y)")   # Describes what y-values represent

# Add a title to the plot
plt.title("Scatter Plot of Example Dataset")

# Display the plot
plt.show()
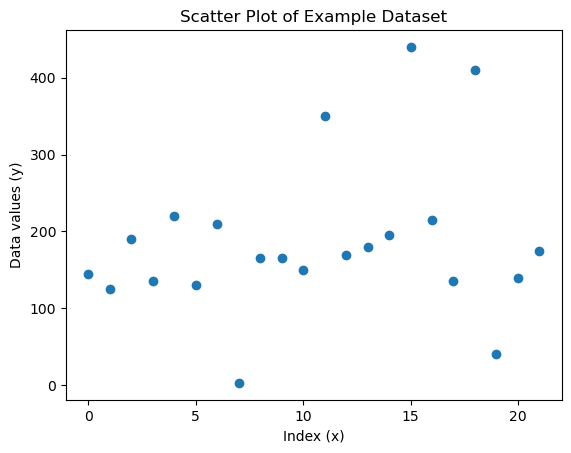
Most values are very close together (between 0.199 and 0.203). We have 3, 40, 350, 410, and 440 as potential outliers. Let’s apply a generalized ESD test.
Null hypothesis (\(H_{0}\)): there are no outliers in the data
Alternative hypothesis (\(H_{a}\)): there are up to 6 outliers in the data
# Define a function with loop to iterate over maximum number of outliers

def generalized_esd_test(data, max_outliers, alpha):
    """
    Perform the Generalized ESD test for detecting multiple outliers in a dataset.

    Parameters:
    data (list or np.array): input numerical data
    max_outliers (int): maximum number of outliers to test for
    alpha (float): significance level (commonly 0.05 for 5%)

    Returns:
    dictionary (dict) containing
        - outlier_indices: list of indices of detected outliers
        - outliers: list of outlier values
        - test_statistics: list of calculated test statistics R for each iteration
        - critical_values: list of calculated critical values λ for each iteration
    """
    # Convert data to numpy array for easier manipulation
    data = np.array(data)

    # Determine the length of the dataset
    n = len(data)

    # Lists to store data
    outlier_indices = []
    outliers = []
    test_statistics = []
    critical_values = []

    # Copy of the data to modify iteratively
    data_copy = data.copy()

    # Loop and compute and compare test statistic R and critical value λ
    for i in range(1, max_outliers + 1):

        # Calculate test statistic R for this iteration
        mean = np.mean(data_copy)             # Mean of the dataset
        std = np.std(data_copy, ddof=1)       # Sample standard deviation
        abs_diff = np.abs(data_copy - mean)   # Absolute differences of each dataset value from the mean
        max_abs_diff = np.max(abs_diff)       # Largest absolute difference from the mean
        R = max_abs_diff / std                # Largest deviation divided by sample standard deviation, test statistic R

        # Select the dataset value to remove
        max_index = np.argmax(abs_diff)                               # Maximum absolute difference from the mean
        actual_index = np.where(data == data_copy[max_index])[0][0]   # Calculate the index of the maximum absolute difference in the original data

        # Compute critical value λ for this iteration
        p = 1 - alpha / (2 * (n - i + 1))     # Define p
        t = stats.t.ppf(p, n - i - 1)         # Critical value for two-tailed test
        lambda_crit = ((n - i) * t) / (np.sqrt((n - i - 1 + t**2) * (n - i + 1)))   # Formula for critical value λ

        # Store values for inspection
        outlier_indices.append(actual_index)
        outliers.append(data_copy[max_index])
        test_statistics.append(R)
        critical_values.append(lambda_crit)

        # Remove the detected outlier from the copy of data for the next iteration
        data_copy = np.delete(data_copy, max_index)

    # Build DataFrame for all iterations
    df = pd.DataFrame({
        "Iteration": range(1, len(test_statistics) + 1),
        "Index": outlier_indices,
        "Value": outliers,
        "Test Statistic (R)": test_statistics,
        "Critical Value (λ)": critical_values
    })

    # Add decision column: Was the suspected outlier flagged?
    df["R > λ ?"] = df["Test Statistic (R)"] > df["Critical Value (λ)"]

    return df
# Example usage of function

result = generalized_esd_test(y, 6, 0.05)
print(result)
   Iteration  Index  Value  Test Statistic (R)  Critical Value (λ)  R > λ ?
0          1     15    440            2.497556            2.757735    False
1          2     18    410            2.729992            2.733780    False
2          3     11    350            2.714963            2.708246     True
3          4      7      3            2.721414            2.680931     True
4          5     19     40            2.838520            2.651599     True
5          6      4    220            1.707766            2.619964    False
In this example, the largest number of outliers for which the test statistic is greater than the critical value (at the 5 % level) is five. We can conclude that there are five outliers in this dataset.